> ## Documentation Index
> Fetch the complete documentation index at: https://docs.kinetica.com/llms.txt
> Use this file to discover all available pages before exploring further.
# Stats
Detailed statistics dashboards about *Kinetica* and its host(s) can be accessed
under the **Stats** menu. Collected statistics are divided into four
groups:
* *Kinetica*
* [Tiered storage and resource groups](/content/rm/concepts)
* System
* GPU (if the CUDA version of Kinetica is installed)
The **Stats** section is only available to users
with the *System Admin* permission.
## Kinetica
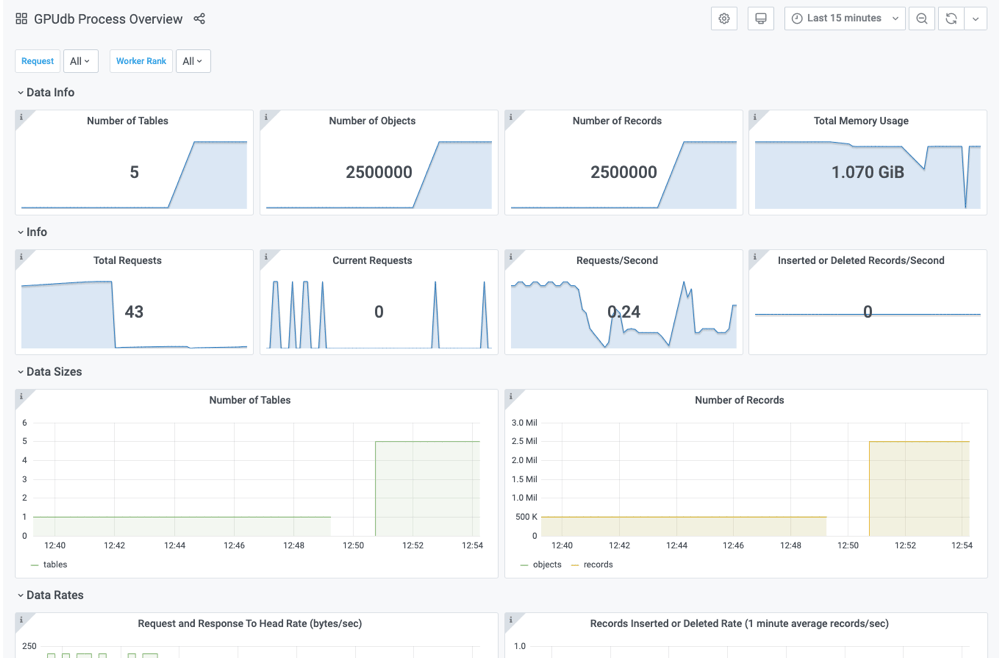
The **Kinetica DB Overview** dashboard is home to metrics related to the
performance and health of your entire *Kinetica* instance. These metrics are
also available on a per-processing-node basis for each node in your cluster,
e.g., your head *Kinetica* node and any workers.
This dashboard (and some of the others) support viewing individual
metrics via the drop-down menus in the top-left corner.
 ## Tiered Storage and Resource Groups
The tiered storage and resource groups metrics are grouped into three stats
dashboards:
* **Memory Tiers** -- metrics related to the memory-based storage tiers,
e.g., [VRAM](/content/rm/concepts#rm-concepts-tiers-vram) and
[RAM](/content/rm/concepts#rm-concepts-tiers-ram)
* **File Backed Tiers** -- metrics related to the file-backed storage
tiers, e.g., [Disk Cache](/content/rm/concepts#rm-concepts-tiers-disk),
[Persist](/content/rm/concepts#rm-concepts-tiers-persist), and
[Cold Storage](/content/rm/concepts#rm-concepts-tiers-cold)
* **Resource Groups** -- metrics related to the
[resource groups](/content/rm/concepts#rm-concepts-resource-groups) that work within the
database
## Systems Overview
The **Host Systems Overview** dashboard is home to metrics related to
the machine(s) *Kinetica* is installed on. These metrics are also available
on a per-host basis for each node in your cluster.
## GPU Overview
This dashboard is home to metrics related to the performance and health of your
GPUs (if applicable).
## Tiered Storage and Resource Groups
The tiered storage and resource groups metrics are grouped into three stats
dashboards:
* **Memory Tiers** -- metrics related to the memory-based storage tiers,
e.g., [VRAM](/content/rm/concepts#rm-concepts-tiers-vram) and
[RAM](/content/rm/concepts#rm-concepts-tiers-ram)
* **File Backed Tiers** -- metrics related to the file-backed storage
tiers, e.g., [Disk Cache](/content/rm/concepts#rm-concepts-tiers-disk),
[Persist](/content/rm/concepts#rm-concepts-tiers-persist), and
[Cold Storage](/content/rm/concepts#rm-concepts-tiers-cold)
* **Resource Groups** -- metrics related to the
[resource groups](/content/rm/concepts#rm-concepts-resource-groups) that work within the
database
## Systems Overview
The **Host Systems Overview** dashboard is home to metrics related to
the machine(s) *Kinetica* is installed on. These metrics are also available
on a per-host basis for each node in your cluster.
## GPU Overview
This dashboard is home to metrics related to the performance and health of your
GPUs (if applicable).