> ## Documentation Index
> Fetch the complete documentation index at: https://docs.kinetica.com/llms.txt
> Use this file to discover all available pages before exploring further.
# Dashboard
The **Dashboard** page in *KAgent* hosts cluster and ring summary
information, which provides a quick way to gather the health of your
Kinetica environments.
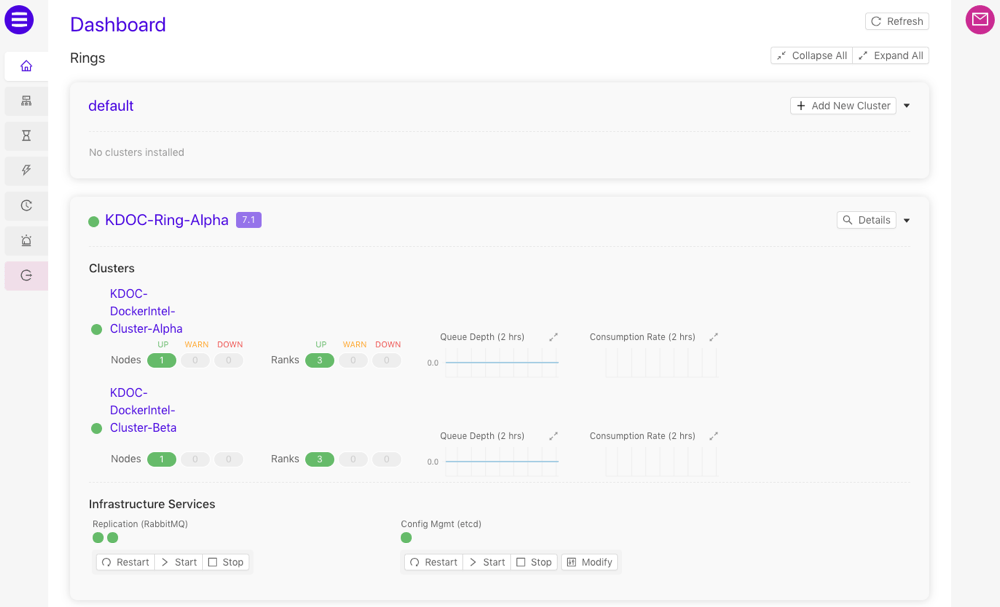
## Rings
**Rings** is the default view for the **Dashboard** page.
The **Rings** view displays a list of the [rings](/content/ha)
added to this instance of *KAgent*. For each ring listed, the following
information is available: a list of clusters in the ring, a visual indicator of
the health of each node in each cluster, and a visual indicator of the health of
each rank in each cluster. If *etcd* and/or *RabbitMQ* are enabled on nodes
within the cluster, the status of those services is available as well as
some management controls.
* Click **Refresh** to refresh the list of rings
* For a given ring in the list, click **Details** to display the
[Ring Summary](#ring-summary) view for that ring
* If a ring does not have any clusters currently, click
**Add New Cluster** to begin the
[cluster installation](/content/install/kagent_install) process.
* If *etcd* is present within the cluster, click **Modify** to update
the *etcd* configuration file using the *KAgent* interface. If *RabbitMQ* is
present within the ring, the [High Availability (HA)](/content/ha)
configuration file will also be editable from the modify *etcd*
configuration window.
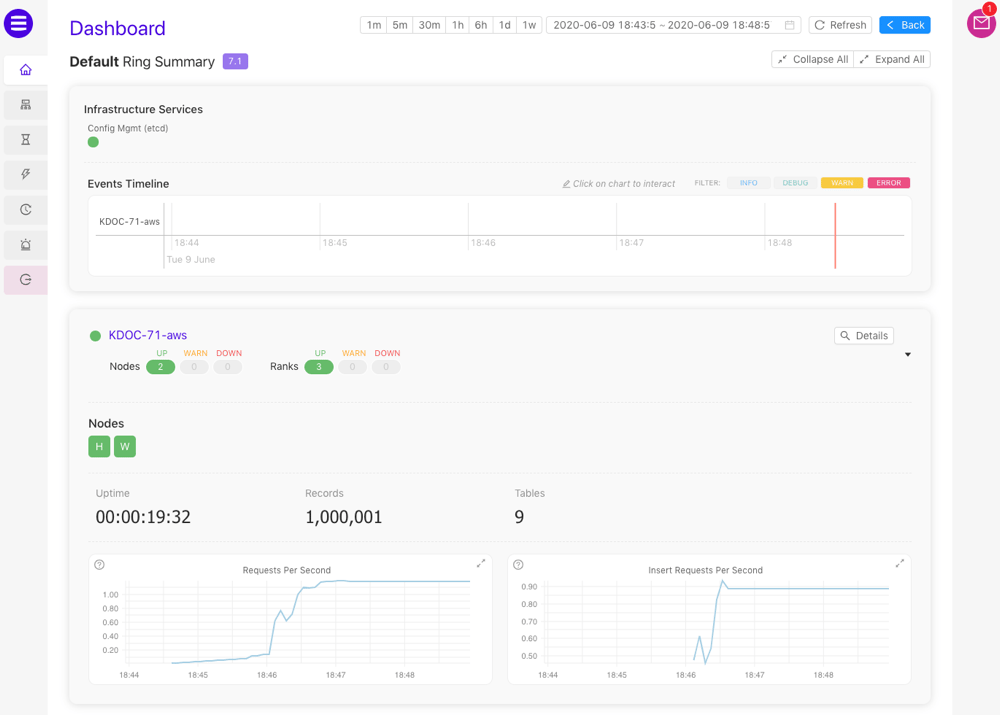
 ## Ring Summary
The **Ring Summary** is accessed via the [Rings](#rings) view. The
**Ring Summary** displays the health of infrastructure services (e.g.,
*etcd*, *RabbitMQ* if [ring resiliency](/content/ha) is enabled, etc.),
the [Events Timeline](#events-timeline), and a list of clusters in the ring. For each cluster
listed, the following information is available: the name of the cluster, a
visual indicator of the health of each node and rank in the cluster, a list of
nodes (a detailed status is available upon cursor hover) in the cluster and
basic performance statistics & metrics. *Head nodes* are labeled with an `H`
to set them apart from worker nodes (`W`).
* Click one of the timeframe control buttons or select a date-time range to
adjust the event timeline and the metric graphs to the selected duration
* Click **Refresh** to refresh the **Ring Summary** and
**Events Timeline**
* Click **Back** to return to the [Rings](#rings) view
* Click **Collapse All** or **Expand All** to collapse or
expand the cluster information cards in the list
* For a given cluster in the list, click **Details** to display the
[Cluster Summary](#cluster-summary) view for that cluster
* Point the cursor to a graph to see the value at that time
## Ring Summary
The **Ring Summary** is accessed via the [Rings](#rings) view. The
**Ring Summary** displays the health of infrastructure services (e.g.,
*etcd*, *RabbitMQ* if [ring resiliency](/content/ha) is enabled, etc.),
the [Events Timeline](#events-timeline), and a list of clusters in the ring. For each cluster
listed, the following information is available: the name of the cluster, a
visual indicator of the health of each node and rank in the cluster, a list of
nodes (a detailed status is available upon cursor hover) in the cluster and
basic performance statistics & metrics. *Head nodes* are labeled with an `H`
to set them apart from worker nodes (`W`).
* Click one of the timeframe control buttons or select a date-time range to
adjust the event timeline and the metric graphs to the selected duration
* Click **Refresh** to refresh the **Ring Summary** and
**Events Timeline**
* Click **Back** to return to the [Rings](#rings) view
* Click **Collapse All** or **Expand All** to collapse or
expand the cluster information cards in the list
* For a given cluster in the list, click **Details** to display the
[Cluster Summary](#cluster-summary) view for that cluster
* Point the cursor to a graph to see the value at that time
 ### Events Timeline
The **Events Timeline** displays events that have occurred within
the selected timeframe. A red cursor continuously moves through the timeline,
denoting seconds as they pass. Events will appear along the timeline in real
time.
### Events Timeline
The **Events Timeline** displays events that have occurred within
the selected timeframe. A red cursor continuously moves through the timeline,
denoting seconds as they pass. Events will appear along the timeline in real
time.
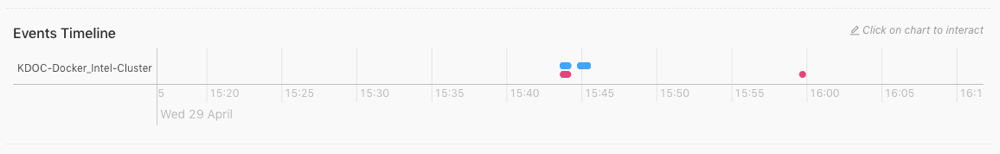 First, click the **Events Timeline**, then:
* Scroll to zoom in and out on the timeline
* Click and drag left and right to move the timeline backward and forward
respectively
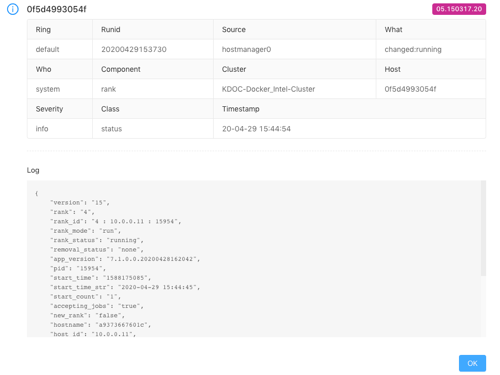
* Click an event dot to open detailed information, including the source of the
event, the [event code](/content/admin/event_codes), the timestamp of the
event, and more:
First, click the **Events Timeline**, then:
* Scroll to zoom in and out on the timeline
* Click and drag left and right to move the timeline backward and forward
respectively
* Click an event dot to open detailed information, including the source of the
event, the [event code](/content/admin/event_codes), the timestamp of the
event, and more:
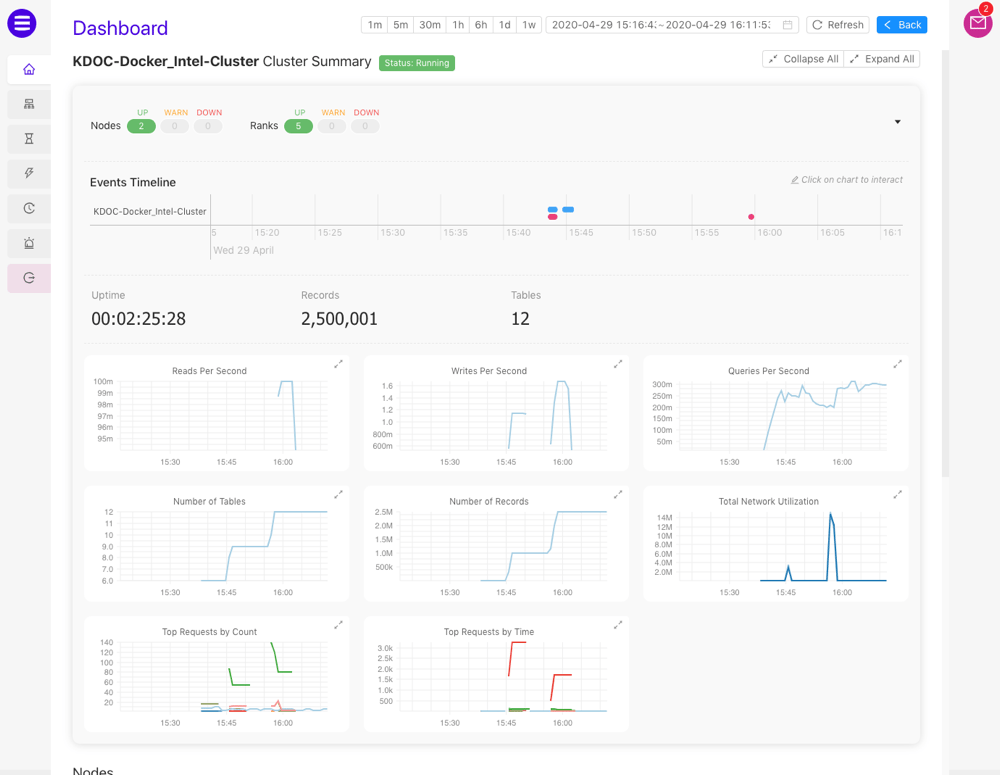
 ## Cluster Summary
The **Cluster Summary** is accessed via the [Ring Summary](#ring-summary) view. The
**Cluster Summary** displays similar information as the [Ring Summary](#ring-summary)
but with additional performance metrics and a list of nodes within the
cluster. For each node listed, the following information is available: the name
and IP address for the node, the services being hosted by the node, a visual
indicator of the health of each rank in the node, a list of ranks (a detailed
status is available upon cursor hover) in the cluster, and basic performance
statistics & metrics.
* Click one of the timeframe control buttons or select a date-time range to
adjust the event timeline and the metric graphs to the selected duration
* Click **Refresh** to refresh the **Cluster Summary** and
**Events Timeline**
* Click **Back** to return to the [Ring Summary](#ring-summary) view
* Click **Collapse All** or **Expand All** to collapse or
expand the cluster and node information cards in the list
* Point the cursor to a graph to see the value at that time
## Cluster Summary
The **Cluster Summary** is accessed via the [Ring Summary](#ring-summary) view. The
**Cluster Summary** displays similar information as the [Ring Summary](#ring-summary)
but with additional performance metrics and a list of nodes within the
cluster. For each node listed, the following information is available: the name
and IP address for the node, the services being hosted by the node, a visual
indicator of the health of each rank in the node, a list of ranks (a detailed
status is available upon cursor hover) in the cluster, and basic performance
statistics & metrics.
* Click one of the timeframe control buttons or select a date-time range to
adjust the event timeline and the metric graphs to the selected duration
* Click **Refresh** to refresh the **Cluster Summary** and
**Events Timeline**
* Click **Back** to return to the [Ring Summary](#ring-summary) view
* Click **Collapse All** or **Expand All** to collapse or
expand the cluster and node information cards in the list
* Point the cursor to a graph to see the value at that time