> ## Documentation Index
> Fetch the complete documentation index at: https://docs.kinetica.com/llms.txt
> Use this file to discover all available pages before exploring further.
# Using Tableau with Kinetica
Tableau integrates with *Kinetica* through the *Kinetica* ODBC/JDBC drivers.
The drivers can be installed from GitHub:
* [JDBC](https://github.com/kineticadb/kinetica-client-jdbc)
* [ODBC](https://github.com/kineticadb/kinetica-client-win-odbc)
To visualize maps from Kinetica-hosted datasets, see
[Kinetica Geospatial Visualization for Tableau](/content/bi/tableau/kin_geo_viz_tableau).
Once you have installed the driver, follow the steps below to view your
*Kinetica* data from Tableau.
Follow the
[Tableau connection guide](https://help.tableau.com/current/pro/desktop/en-us/examples_otherdatabases_jdbc.htm)
to set up a *JDBC* connection. Visit the
[SQL Connector](/content/connectors/sql_guide) page for information on
setting up an *ODBC* connection. Note that *ODBC* may have better performance
than *JDBC*, but *JDBC* is compatible with *macOS* environments.
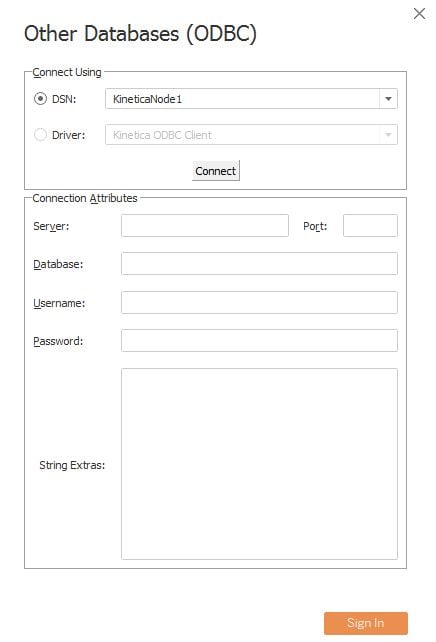
If using the *ODBC* driver, integrate it with Tableau:
1. Create an ODBC DSN for your *Kinetica* instance/schema using the ODBC
Data Sources *Windows* application
2. In Tableau, select the *Kinetica* DSN
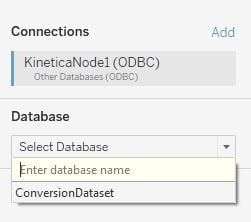
 3. Once the ODBC connection has been made, you will see your schema in the
**Select Database** options. Select the schema
3. Once the ODBC connection has been made, you will see your schema in the
**Select Database** options. Select the schema
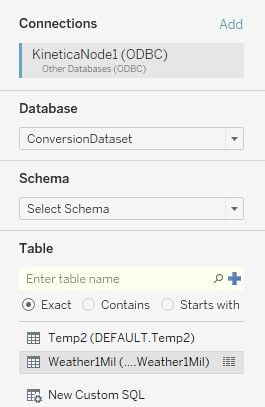
 4. Select the *table* containing the data you want to view
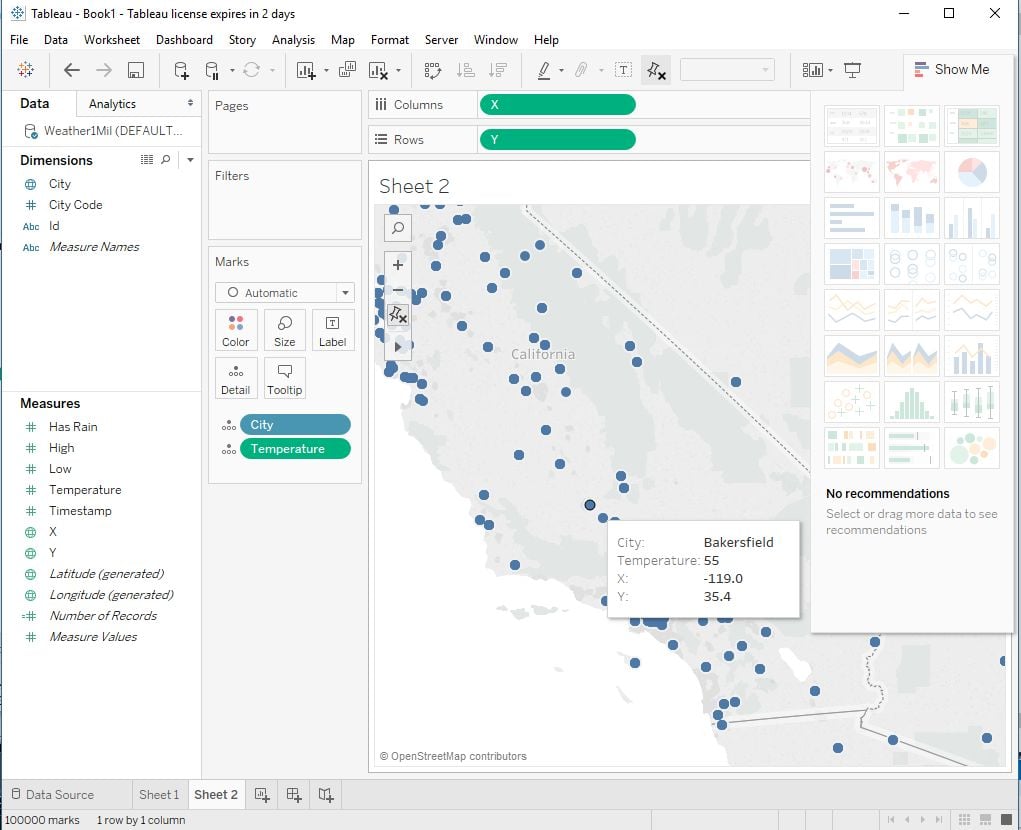
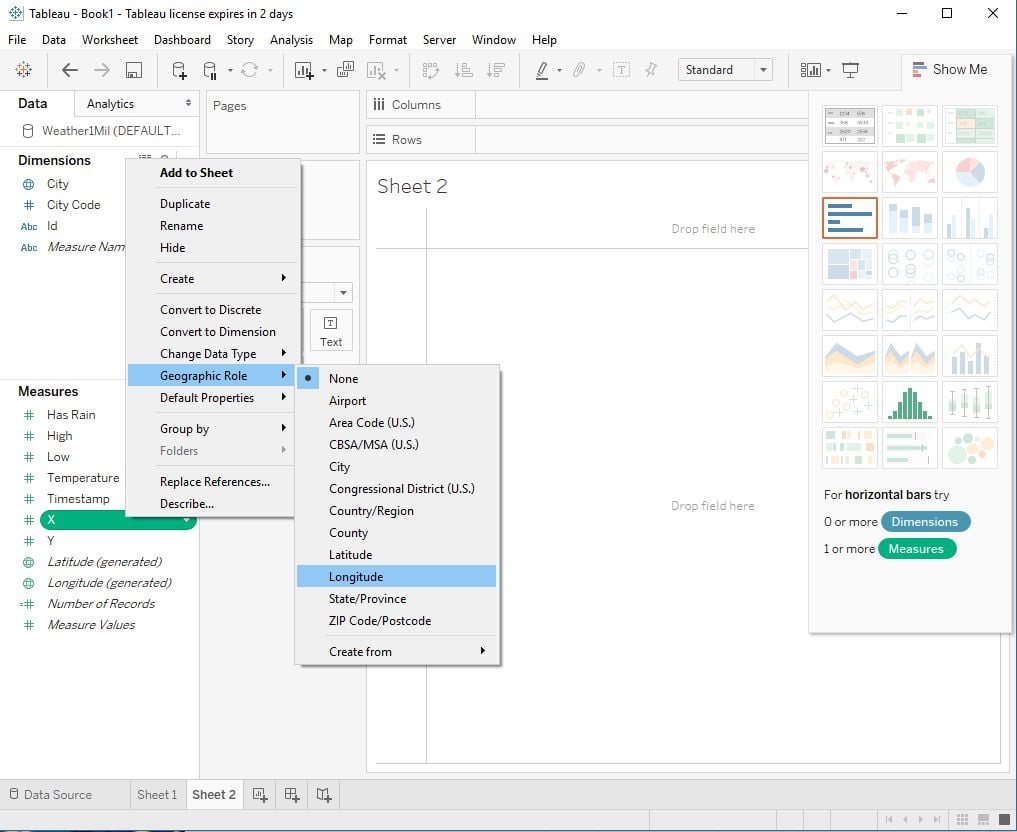
 5. From a sheet, configure the fields as needed. In this example, the "x" field
is set as longitude and the "y" field is set as latitude.
5. From a sheet, configure the fields as needed. In this example, the "x" field
is set as longitude and the "y" field is set as latitude.
 6. Add the fields you want to view and the type of display