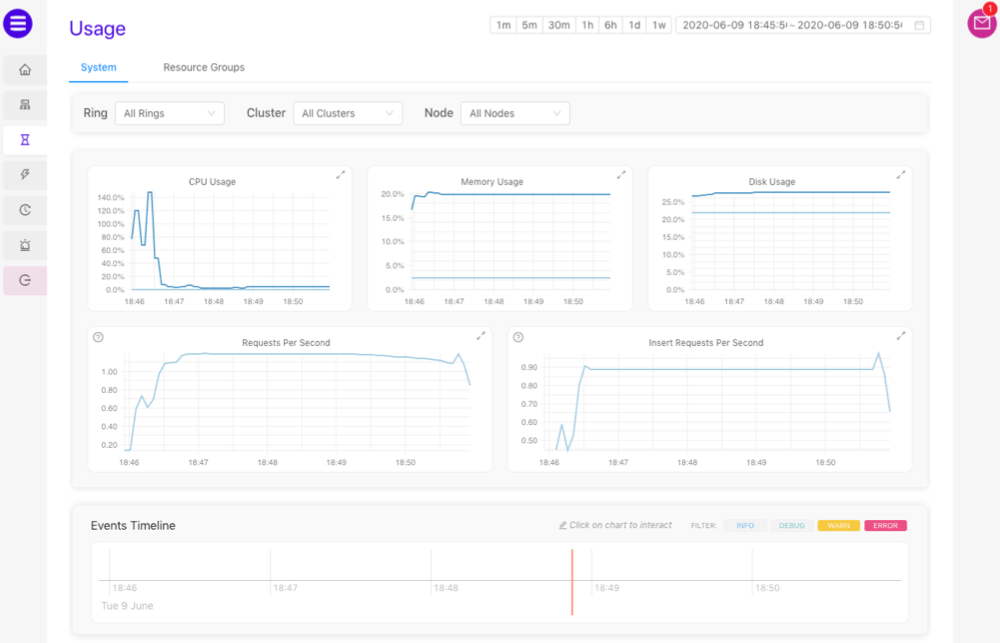
System
The System tab under the Usage page displays several system usage metric and statistics graphs as well as an Events Timeline.- Click one of the timeframe control buttons or select a date-time range to adjust the event timeline and the metric graphs to the selected duration
- Adjust the Ring, Cluster, and/or Node drop-down menus to filter the graphs for the selected ring / cluster / node
- Point the cursor to a graph to see the value at that time
Events Timeline
The Events Timeline displays events that have occurred within the selected timeframe. A red cursor continuously moves through the timeline, denoting seconds as they pass. Events will appear along the timeline in real time.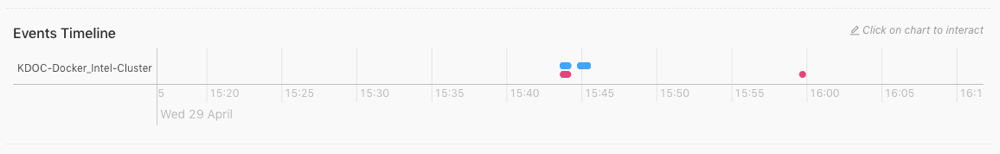
- Scroll to zoom in and out on the timeline
- Click and drag left and right to move the timeline backward and forward respectively
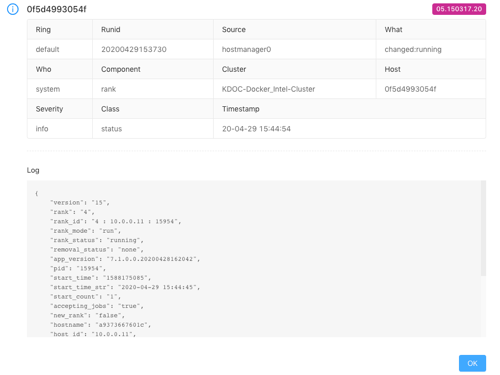
-
Click an event dot to open detailed information, including the source of the
event, the event code, the timestamp of the
event, and more:
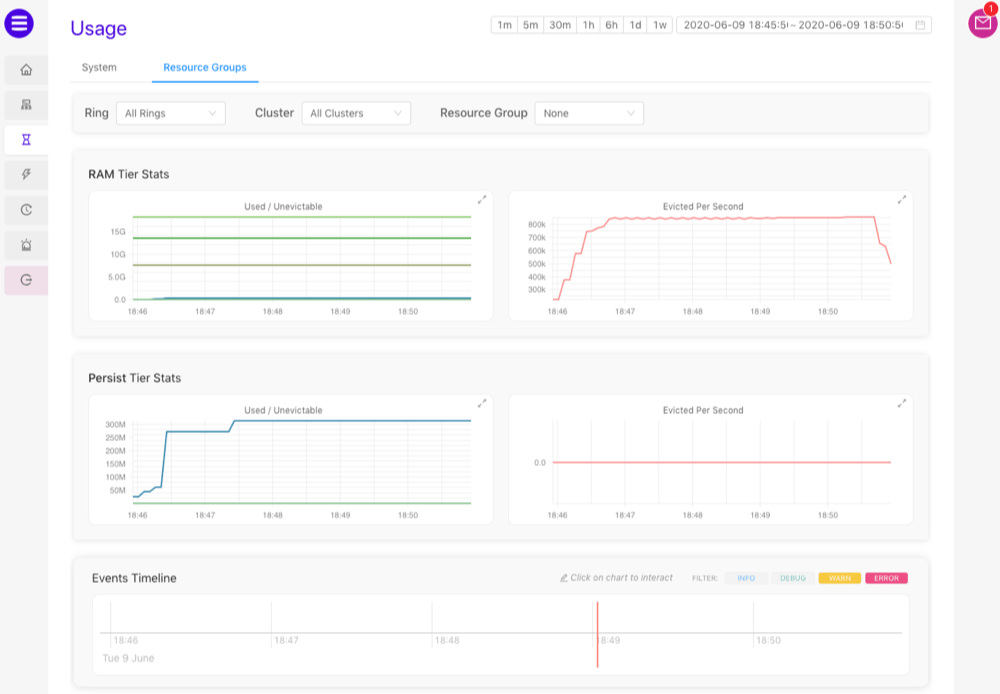
Resource Groups
The Resources Groups tab under the Usage page displays metrics and statistics graphs for select configured storage tiers as well as an Events Timeline.- Click one of the timeframe control buttons or select a date-time range to adjust the event timeline and the metric graphs to the selected duration
- Adjust the Ring, Cluster, and/or Node drop-down menus to filter the graphs for the selected ring / cluster / node
- Point the cursor to a graph to see the value at that time