
Enrich a Point-Based Table with H3 Indexes

Create an H3 index for pickup locations in the NYC taxi data set.
CREATE OR REPLACE TABLE example_geospatial.nyctaxi_h3 AS
(
	SELECT
		pickup_latitude,
		pickup_longitude,
		H3_XYTOCELL(pickup_longitude, pickup_latitude, 8) AS h3_index
	FROM example_geospatial.nyctaxi_xy
)

Create an Aggregated View with WKT Geometries

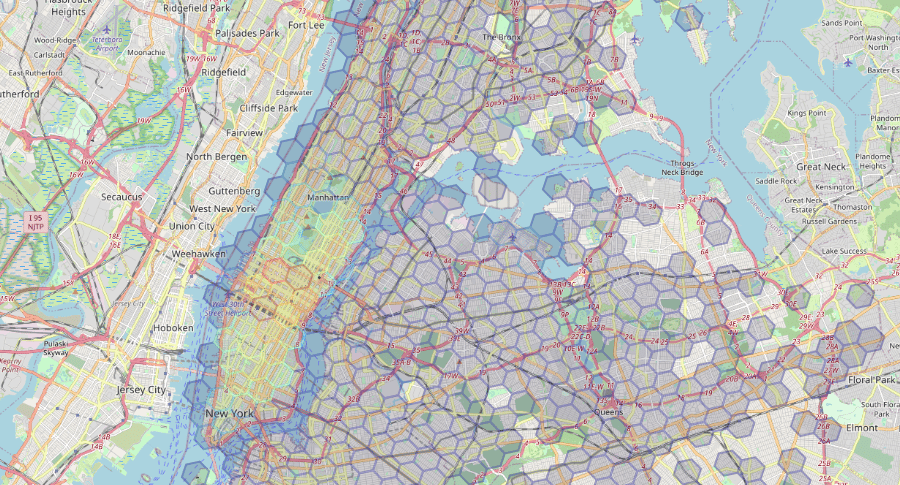
Use the table created above to generate an H3 grid view with the counts of pickups within each cell.
Aggregated Pick-Up Counts per H3 Cell
SELECT
	h3_index,
	H3_CELLTOBOUNDARY(h3_index) AS h3_cell,
	COUNT(*) AS total_pickups
FROM example_geospatial.nyctaxi_h3
GROUP BY h3_index
The H3 grid output as a class break render: geohash-h3.png