Kinetica Data
View Data
All the data in the database can be viewed through the Data menu selection. This lets you view all the collections and tables, delete tables and rows, edit rows, and export data.
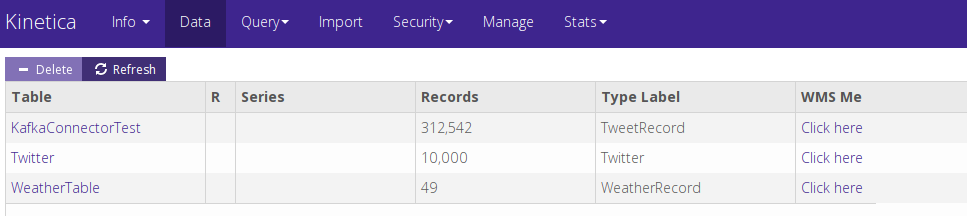
If your data contains geocoordinates, you can use the WMS Me link to view a heatmap of the data.
Note
This function only works on GPU-based instances of Kinetica.
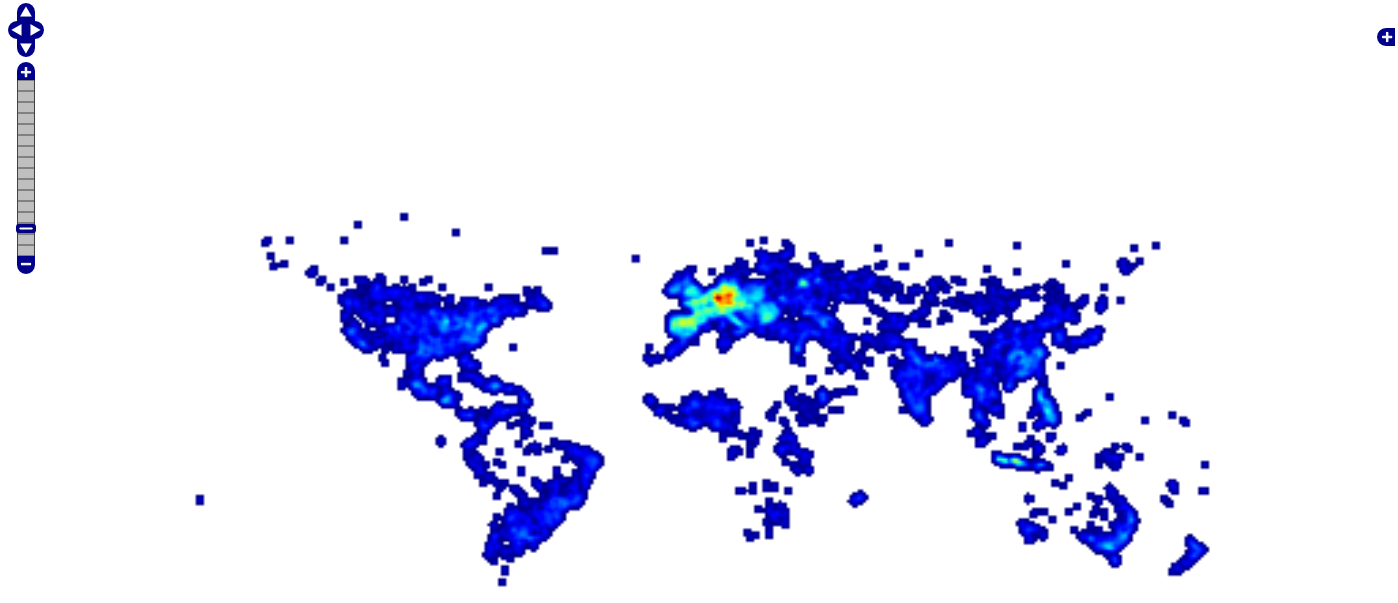
You can use the Zoom bar on the left or the scroll wheel of your mouse to zoom in and out of an area.
To view the individual records in the table, select the table name.
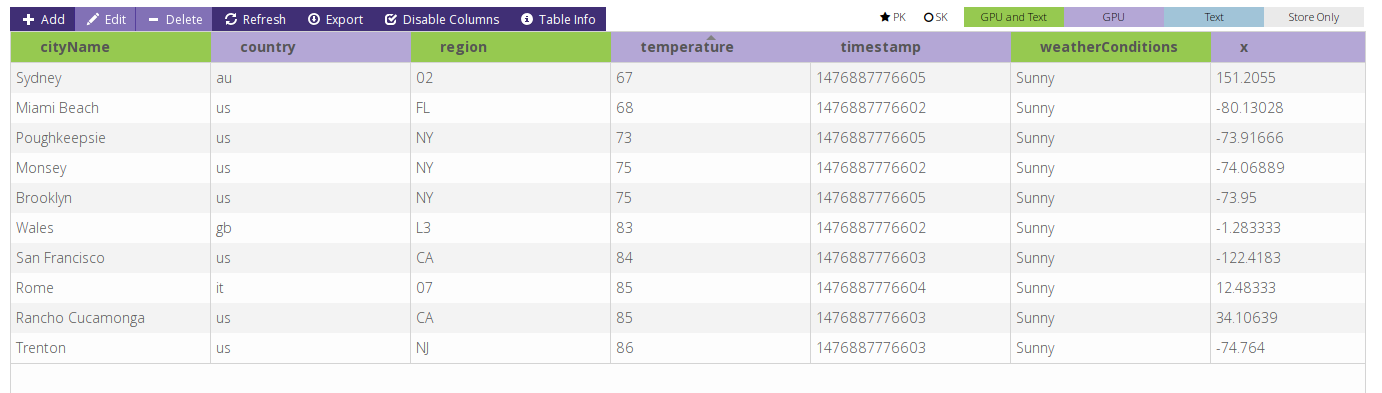
From here, you can edit or delete individual records, hide columns, view table information, and export data.
Export Data
From the table data page, select Export. You will have the option to export all of the data or records within a range.
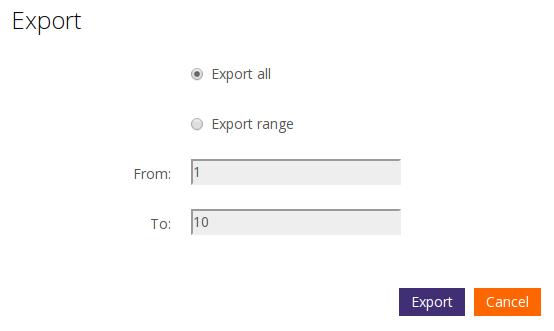
Once you click the Export button, the data will be downloaded to your computer. The exported data is in a csv format, with the first line being the table schema. The schema includes the name,data type, and any additional properties for each field.

Import Data
Data can be imported using the Import menu option.
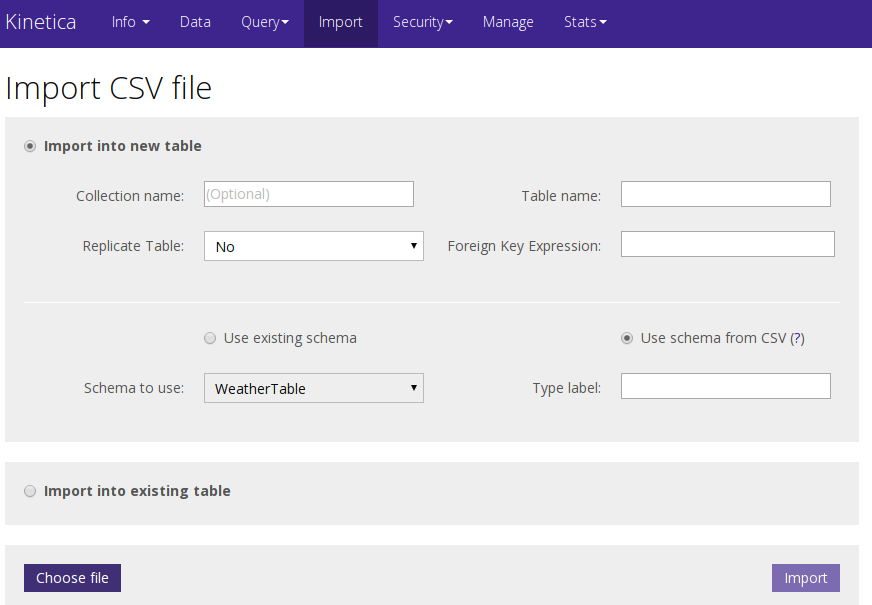
On this screen, you must choose whether to import the data into a new table or one that already exists. If you want to create a new table, you must specify the table name, whether to use an existing schema or the schema from the first row of the CSV file (as described above in Export Data). If you want to import data into a table that already exists, you just need to specify the table name. Then select the Choose file button and navigate to and select the file to import. The system will provide feedback as it is importing the data.
Run Queries
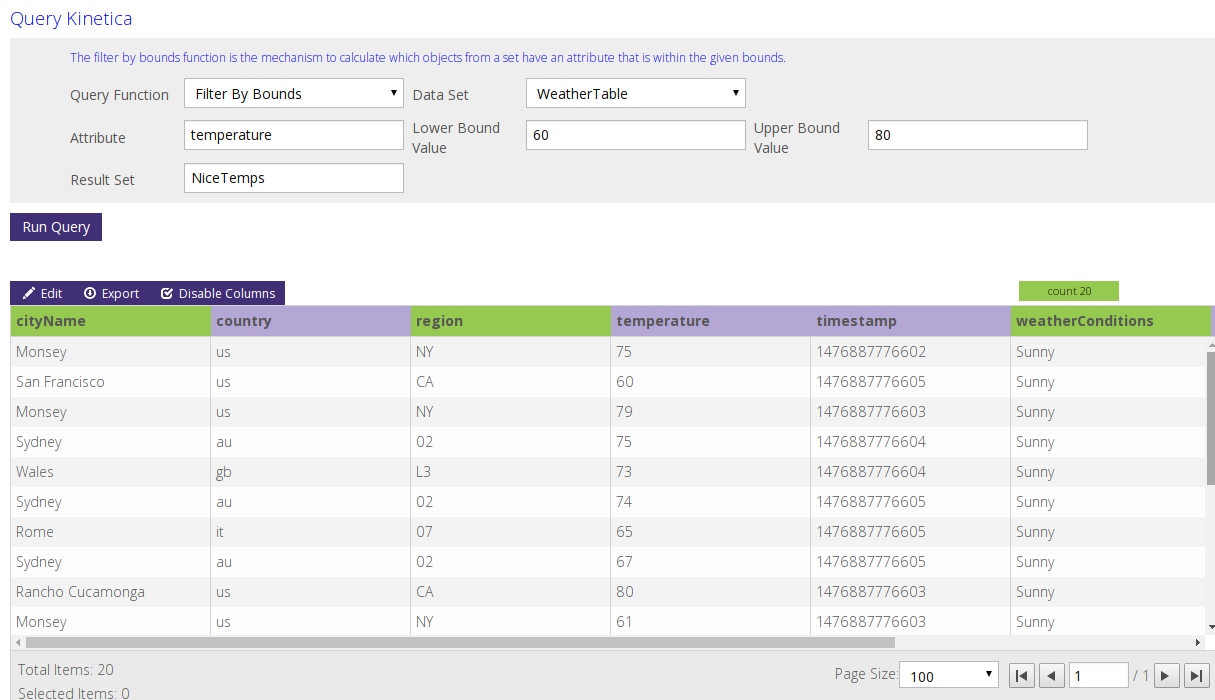
To run filtering or aggregation queries on the data in Kinetica, select the Query menu.
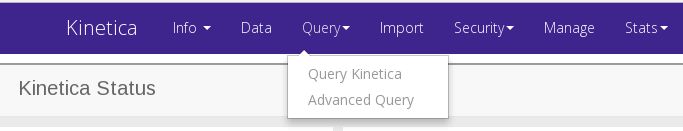
Query Kinetica provides a simple way to run several common queries
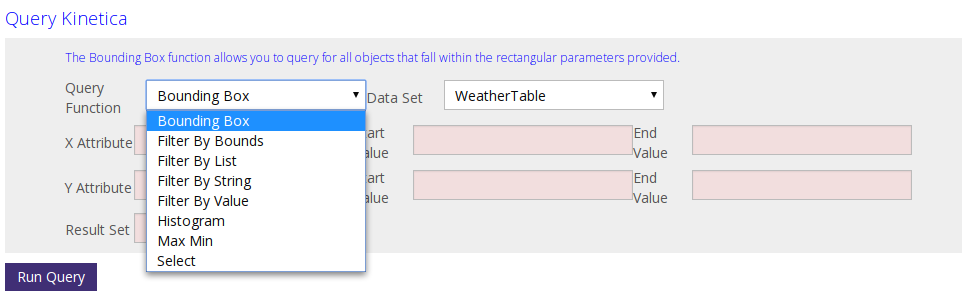
Each query type will display a different set of parameters to fill in. Below is an example of Filter By Bounds.
Advanced Query Tool
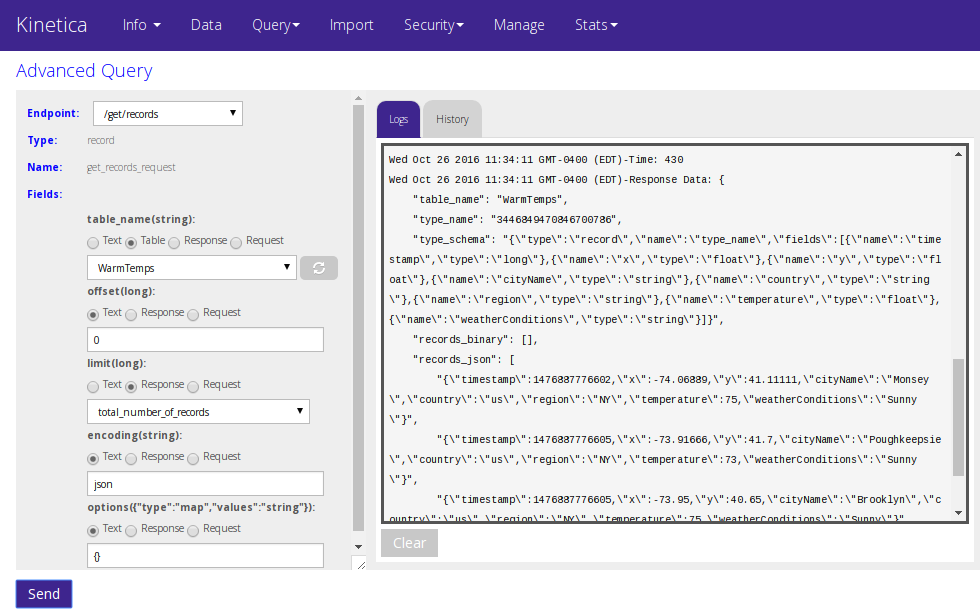
The Advanced Query tool allows you to call any Kinetica REST endpoint. As with the Query Kinetica tool, the parameter fields displayed will change depending on the endpoint. Here is an example of the advanced query tool with the FilterByRange endpoint filled in and the results:
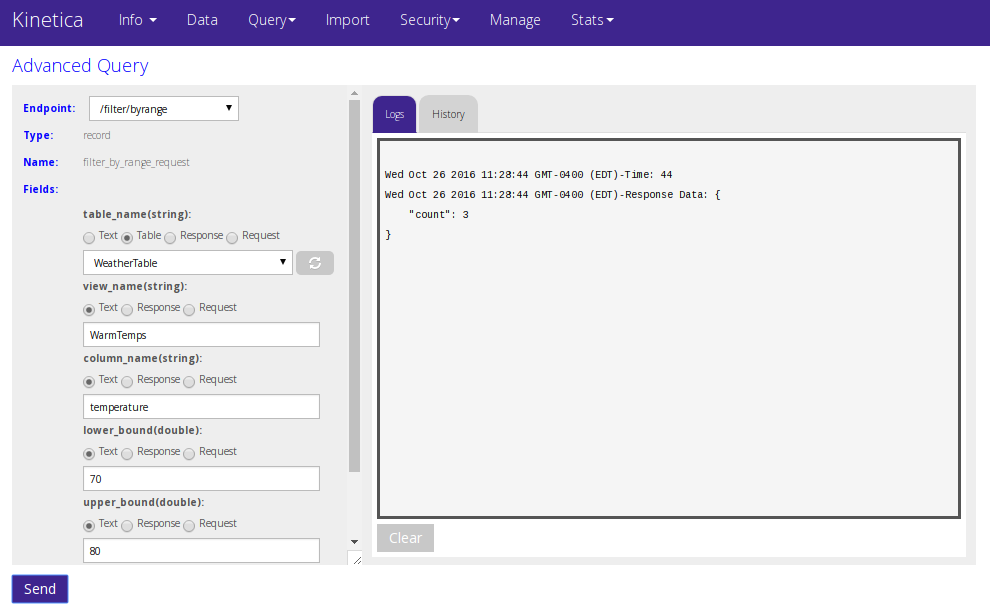
For the first query, you must enter all values using the text option for each field (except table). Subsequent queries can use values from the request or response objects by selecting Request or Response and then choosing the field whose value you want to reuse.
Manage Your Kinetica Instance
The Manage page contains two sections: Kinetica Manager and Kinetica Logs.
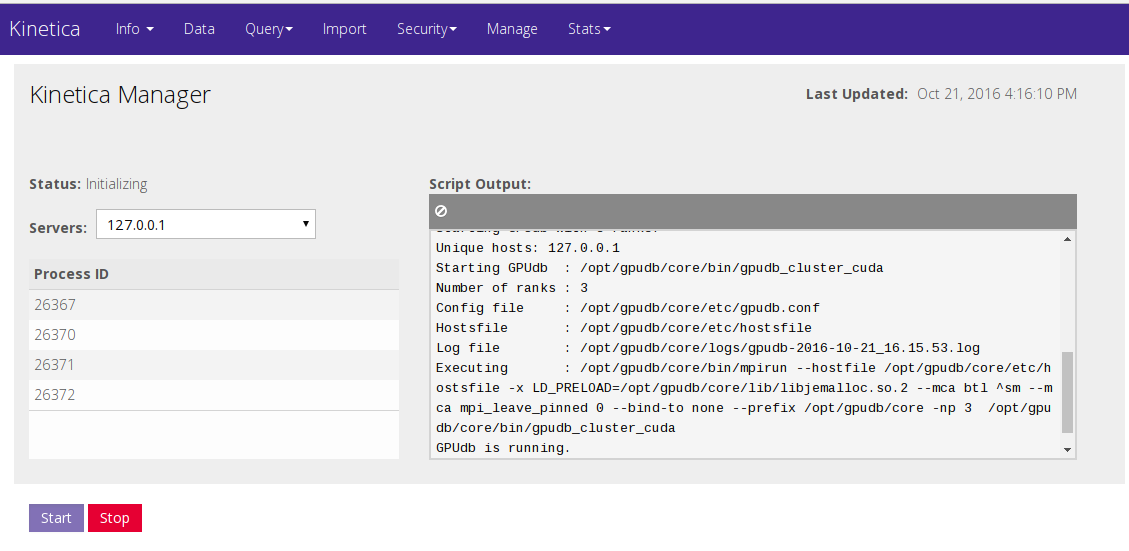
Kinetica Manager
Kinetica Manager lets you start and stop Kinetica and displays the associated output.
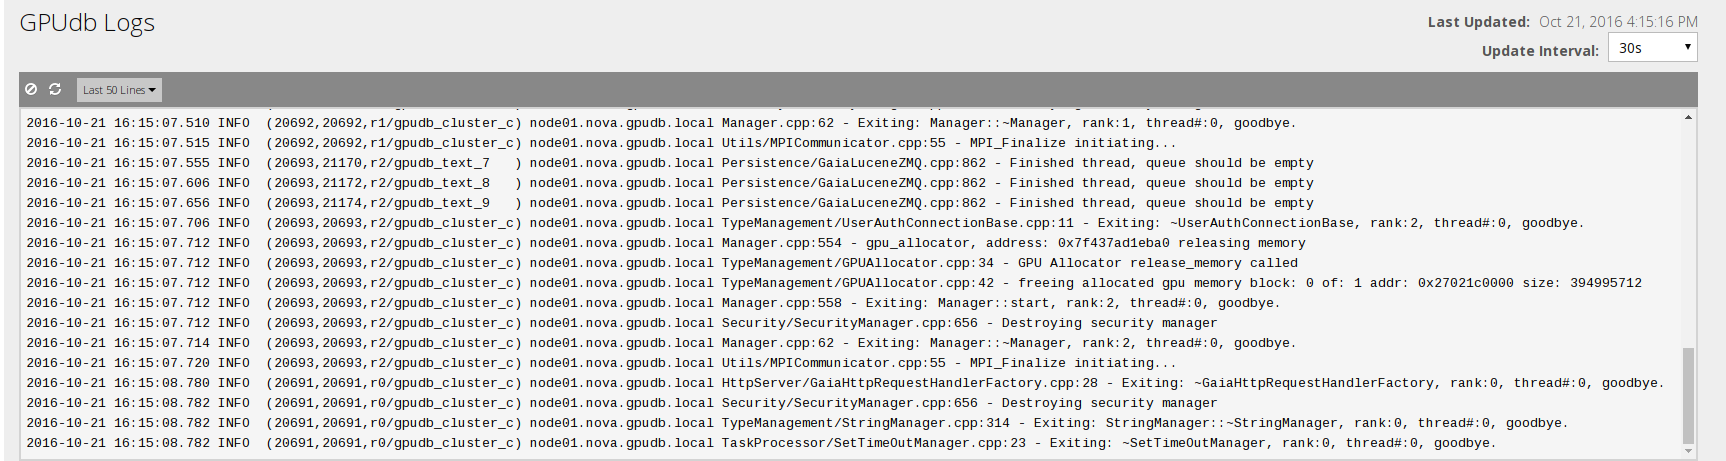
Kinetica Logs
Kinetica Logs displays the logs from the Kinetica server, allowing you to set how many lines of logging to show and how often the display will be updated.