A set of parameters for Kinetica.visualizeImageChart. More...
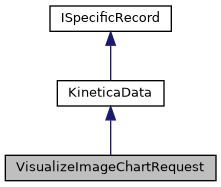
 Inheritance diagram for VisualizeImageChartRequest:
 Collaboration diagram for VisualizeImageChartRequest: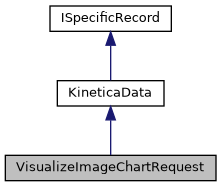
Classes | |
| struct | Options |
| A set of string constants for the parameter options. More... | |
| struct | StyleOptions |
| A set of string constants for the parameter style_options. More... | |
Public Member Functions | |
| VisualizeImageChartRequest () | |
| Constructs a VisualizeImageChartRequest object with default parameters. More... | |
| VisualizeImageChartRequest (string table_name, IList< string > x_column_names, IList< string > y_column_names, double min_x, double max_x, double min_y, double max_y, int width, int height, string bg_color, IDictionary< string, IList< string >> style_options, IDictionary< string, string > options=null) | |
| Constructs a VisualizeImageChartRequest object with the specified parameters. More... | |
| Public Member Functions inherited from KineticaData | |
| KineticaData (KineticaType type) | |
| Constructor from Kinetica Type More... | |
| KineticaData (System.Type type=null) | |
| Default constructor, with optional System.Type More... | |
| object | Get (int fieldPos) |
| Retrieve a specific property from this object More... | |
| void | Put (int fieldPos, object fieldValue) |
| Write a specific property to this object More... | |
Properties | |
| string | table_name [get, set] |
| Name of the table containing the data to be drawn as a chart, in [schema_name. More... | |
| IList< string > | x_column_names = new List<string>() [get, set] |
| Names of the columns containing the data mapped to the x axis of a chart. More... | |
| IList< string > | y_column_names = new List<string>() [get, set] |
| Names of the columns containing the data mapped to the y axis of a chart. More... | |
| double | min_x [get, set] |
| Lower bound for the x column values. More... | |
| double | max_x [get, set] |
| Upper bound for the x column values. More... | |
| double | min_y [get, set] |
| Lower bound for the y column values. More... | |
| double | max_y [get, set] |
| Upper bound for the y column values. More... | |
| int | width [get, set] |
| Width of the generated image in pixels. More... | |
| int | height [get, set] |
| Height of the generated image in pixels. More... | |
| string | bg_color [get, set] |
| Background color of the generated image. More... | |
| IDictionary< string, IList< string > > | style_options = new Dictionary<string, IList<string>>() [get, set] |
| Rendering style options for a chart. More... | |
| IDictionary< string, string > | options = new Dictionary<string, string>() [get, set] |
| Optional parameters. More... | |
| Properties inherited from KineticaData | |
| Schema | Schema [get] |
| Avro Schema for this class More... | |
| Properties inherited from Avro.Specific.ISpecificRecord | |
| Schema | Schema [get] |
Additional Inherited Members | |
| Static Public Member Functions inherited from KineticaData | |
| static ? RecordSchema | SchemaFromType (System.Type t, KineticaType? ktype=null) |
| Create an Avro Schema from a System.Type and a KineticaType. More... | |
Detailed Description
A set of parameters for Kinetica.visualizeImageChart.
Scatter plot is the only plot type currently supported. A non-numeric column can be specified as x or y column and jitters can be added to them to avoid excessive overlapping. All color values must be in the format RRGGBB or AARRGGBB (to specify the alpha value). The image is contained in the image_data field.
Definition at line 21 of file VisualizeImageChart.cs.
Constructor & Destructor Documentation
◆ VisualizeImageChartRequest() [1/2]
|
inline |
Constructs a VisualizeImageChartRequest object with default parameters.
Definition at line 479 of file VisualizeImageChart.cs.
◆ VisualizeImageChartRequest() [2/2]
|
inline |
Constructs a VisualizeImageChartRequest object with the specified parameters.
- Parameters
-
table_name Name of the table containing the data to be drawn as a chart, in [schema_name.]table_name format, using standard name resolution rules. x_column_names Names of the columns containing the data mapped to the x axis of a chart. y_column_names Names of the columns containing the data mapped to the y axis of a chart. min_x Lower bound for the x column values. For non-numeric x column, each x column item is mapped to an integral value starting from 0. max_x Upper bound for the x column values. For non-numeric x column, each x column item is mapped to an integral value starting from 0. min_y Lower bound for the y column values. For non-numeric y column, each y column item is mapped to an integral value starting from 0. max_y Upper bound for the y column values. For non-numeric y column, each y column item is mapped to an integral value starting from 0. width Width of the generated image in pixels. height Height of the generated image in pixels. bg_color Background color of the generated image. style_options Rendering style options for a chart. - POINTCOLOR: The color of points in the plot represented as a hexadecimal number. The default value is '0000FF'.
- POINTSIZE: The size of points in the plot represented as number of pixels. The default value is '3'.
- POINTSHAPE: The shape of points in the plot. Supported values: The default value is SQUARE.
- CB_POINTCOLORS: Point color class break information consisting of three entries: class-break attribute, class-break values/ranges, and point color values. This option overrides the pointcolor option if both are provided. Class-break ranges are represented in the form of "min:max". Class-break values/ranges and point color values are separated by cb_delimiter, e.g. {"price", "20:30;30:40;40:50", "0xFF0000;0x00FF00;0x0000FF"}.
- CB_POINTSIZES: Point size class break information consisting of three entries: class-break attribute, class-break values/ranges, and point size values. This option overrides the pointsize option if both are provided. Class-break ranges are represented in the form of "min:max". Class-break values/ranges and point size values are separated by cb_delimiter, e.g. {"states", "NY;TX;CA", "3;5;7"}.
- CB_POINTSHAPES: Point shape class break information consisting of three entries: class-break attribute, class-break values/ranges, and point shape names. This option overrides the pointshape option if both are provided. Class-break ranges are represented in the form of "min:max". Class-break values/ranges and point shape names are separated by cb_delimiter, e.g. {"states", "NY;TX;CA", "circle;square;diamond"}.
- CB_DELIMITER: A character or string which separates per-class values in a class-break style option string. The default value is ';'.
- X_ORDER_BY: An expression or aggregate expression by which non-numeric x column values are sorted, e.g. "avg(price) descending".
- Y_ORDER_BY: An expression or aggregate expression by which non-numeric y column values are sorted, e.g. "avg(price)", which defaults to "avg(price) ascending".
- SCALE_TYPE_X: Type of x axis scale. Supported values: The default value is NONE.
- SCALE_TYPE_Y: Type of y axis scale. Supported values: The default value is NONE.
-
MIN_MAX_SCALED: If this options is set to
FALSE, this endpoint expects request's min/max values are not yet scaled. They will be scaled according to scale_type_x or scale_type_y for response. If this options is set toTRUE, this endpoint expects request's min/max values are already scaled according to scale_type_x/scale_type_y. Response's min/max values will be equal to request's min/max values. The default value is 'false'. - JITTER_X: Amplitude of horizontal jitter applied to non-numeric x column values. The default value is '0.0'.
- JITTER_Y: Amplitude of vertical jitter applied to non-numeric y column values. The default value is '0.0'.
-
PLOT_ALL: If this options is set to
TRUE, all non-numeric column values are plotted ignoring min_x, max_x, min_y and max_y parameters. The default value is 'false'.
options Optional parameters. -
IMAGE_ENCODING: Encoding to be applied to the output image. When using JSON serialization it is recommended to specify this as BASE64. Supported values:
- BASE64: Apply base64 encoding to the output image.
- NONE: Do not apply any additional encoding to the output image.
Definition at line 715 of file VisualizeImageChart.cs.
Property Documentation
◆ bg_color
|
getset |
Background color of the generated image.
Definition at line 263 of file VisualizeImageChart.cs.
◆ height
|
getset |
Height of the generated image in pixels.
Definition at line 260 of file VisualizeImageChart.cs.
◆ max_x
|
getset |
Upper bound for the x column values.
For non-numeric x column, each x column item is mapped to an integral value starting from 0.
Definition at line 244 of file VisualizeImageChart.cs.
◆ max_y
|
getset |
Upper bound for the y column values.
For non-numeric y column, each y column item is mapped to an integral value starting from 0.
Definition at line 254 of file VisualizeImageChart.cs.
◆ min_x
|
getset |
Lower bound for the x column values.
For non-numeric x column, each x column item is mapped to an integral value starting from 0.
Definition at line 239 of file VisualizeImageChart.cs.
◆ min_y
|
getset |
Lower bound for the y column values.
For non-numeric y column, each y column item is mapped to an integral value starting from 0.
Definition at line 249 of file VisualizeImageChart.cs.
◆ options
|
getset |
Optional parameters.
-
IMAGE_ENCODING: Encoding to be applied to the output image. When using JSON serialization it is recommended to specify this as BASE64. Supported values:
- BASE64: Apply base64 encoding to the output image.
- NONE: Do not apply any additional encoding to the output image.
The default value is an empty Dictionary.
Definition at line 475 of file VisualizeImageChart.cs.
◆ style_options
|
getset |
Rendering style options for a chart.
- POINTCOLOR: The color of points in the plot represented as a hexadecimal number. The default value is '0000FF'.
- POINTSIZE: The size of points in the plot represented as number of pixels. The default value is '3'.
- POINTSHAPE: The shape of points in the plot. Supported values: The default value is SQUARE.
- CB_POINTCOLORS: Point color class break information consisting of three entries: class-break attribute, class-break values/ranges, and point color values. This option overrides the pointcolor option if both are provided. Class-break ranges are represented in the form of "min:max". Class-break values/ranges and point color values are separated by cb_delimiter, e.g. {"price", "20:30;30:40;40:50", "0xFF0000;0x00FF00;0x0000FF"}.
- CB_POINTSIZES: Point size class break information consisting of three entries: class-break attribute, class-break values/ranges, and point size values. This option overrides the pointsize option if both are provided. Class-break ranges are represented in the form of "min:max". Class-break values/ranges and point size values are separated by cb_delimiter, e.g. {"states", "NY;TX;CA", "3;5;7"}.
- CB_POINTSHAPES: Point shape class break information consisting of three entries: class-break attribute, class-break values/ranges, and point shape names. This option overrides the pointshape option if both are provided. Class-break ranges are represented in the form of "min:max". Class-break values/ranges and point shape names are separated by cb_delimiter, e.g. {"states", "NY;TX;CA", "circle;square;diamond"}.
- CB_DELIMITER: A character or string which separates per-class values in a class-break style option string. The default value is ';'.
- X_ORDER_BY: An expression or aggregate expression by which non-numeric x column values are sorted, e.g. "avg(price) descending".
- Y_ORDER_BY: An expression or aggregate expression by which non-numeric y column values are sorted, e.g. "avg(price)", which defaults to "avg(price) ascending".
- SCALE_TYPE_X: Type of x axis scale. Supported values: The default value is NONE.
- SCALE_TYPE_Y: Type of y axis scale. Supported values: The default value is NONE.
-
MIN_MAX_SCALED: If this options is set to
FALSE, this endpoint expects request's min/max values are not yet scaled. They will be scaled according to scale_type_x or scale_type_y for response. If this options is set toTRUE, this endpoint expects request's min/max values are already scaled according to scale_type_x/scale_type_y. Response's min/max values will be equal to request's min/max values. The default value is 'false'. - JITTER_X: Amplitude of horizontal jitter applied to non-numeric x column values. The default value is '0.0'.
- JITTER_Y: Amplitude of vertical jitter applied to non-numeric y column values. The default value is '0.0'.
-
PLOT_ALL: If this options is set to
TRUE, all non-numeric column values are plotted ignoring min_x, max_x, min_y and max_y parameters. The default value is 'false'.
Definition at line 447 of file VisualizeImageChart.cs.
◆ table_name
|
getset |
Name of the table containing the data to be drawn as a chart, in [schema_name.
]table_name format, using standard name resolution rules.
Definition at line 226 of file VisualizeImageChart.cs.
◆ width
|
getset |
Width of the generated image in pixels.
Definition at line 257 of file VisualizeImageChart.cs.
◆ x_column_names
|
getset |
Names of the columns containing the data mapped to the x axis of a chart.
Definition at line 230 of file VisualizeImageChart.cs.
◆ y_column_names
|
getset |
Names of the columns containing the data mapped to the y axis of a chart.
Definition at line 234 of file VisualizeImageChart.cs.
The documentation for this class was generated from the following file:
- Kinetica/Protocol/VisualizeImageChart.cs