- The status of Kinetica
- How many users are connected to Kinetica
- How many requests per second are being made to Kinetica
- How many tables are present in this Kinetica cluster
- How many rows are present in this Kinetica cluster
- The uptime of this Kinetica cluster
- A refresh button to refresh the cluster information

Dashboard
The Dashboard page is also the GAdmin homepage. It highlights the most important information about all the machines in your cluster, including CPU, Memory, and Disk usage.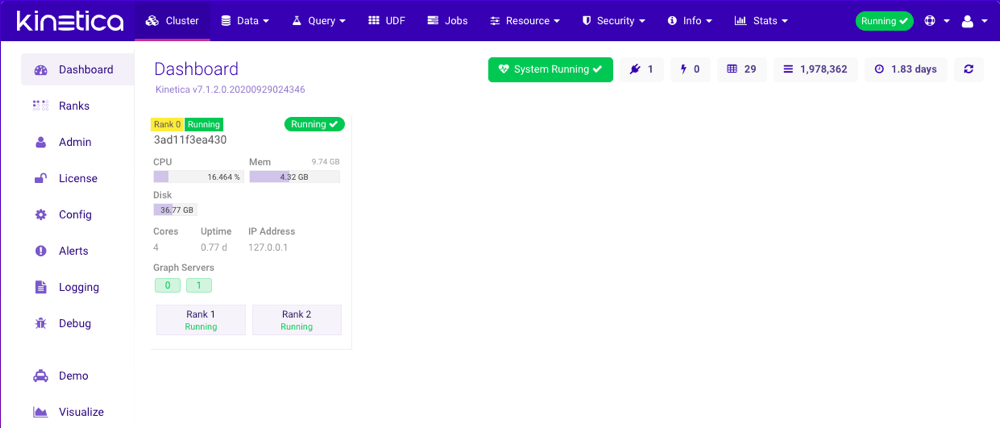
Ranks
The Ranks page displays important information about all the GPU ranks being used in your cluster.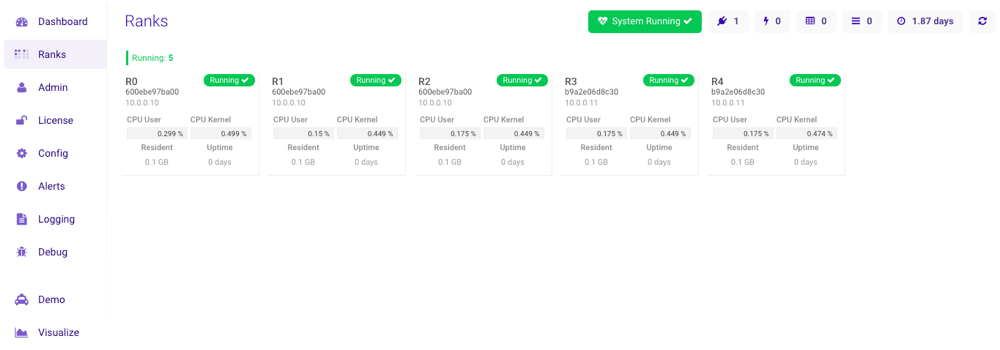
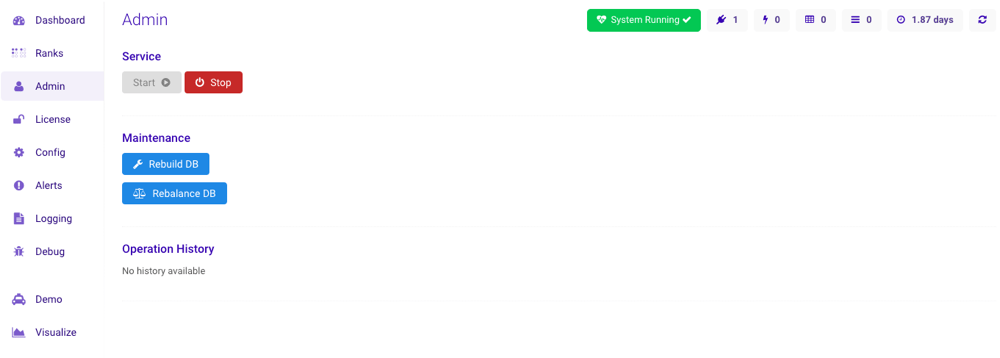
Admin
The Cluster —> Admin section is only available to users
with the System Admin permission.
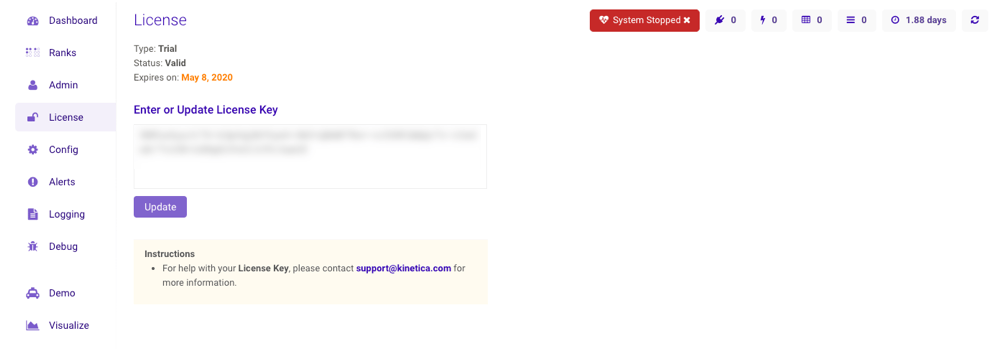
License
The Cluster —> License section is only available to users
with the System Admin permission.
The license can only be modified when Kinetica is not running.
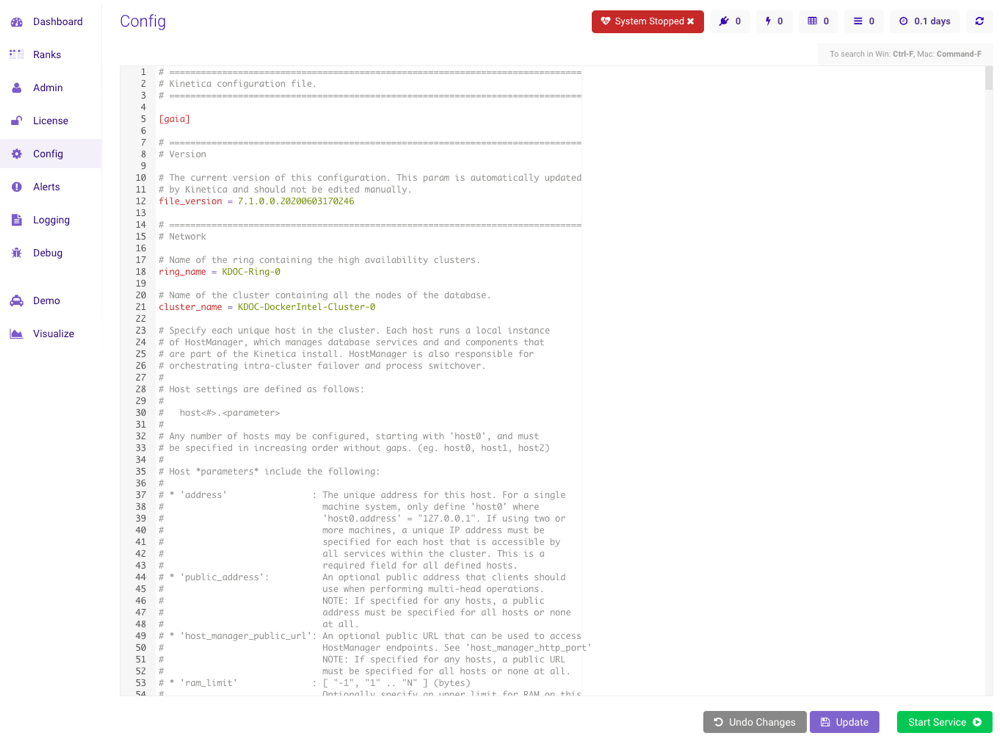
Config
The Cluster —> Config section is only available to users
with the System Admin permission.
This tab can only be edited when Kinetica is not running.
Alerts
The Alerts displays the most recent triggered alerts. Detailed information about alerts and how to set them can be found on Alerting.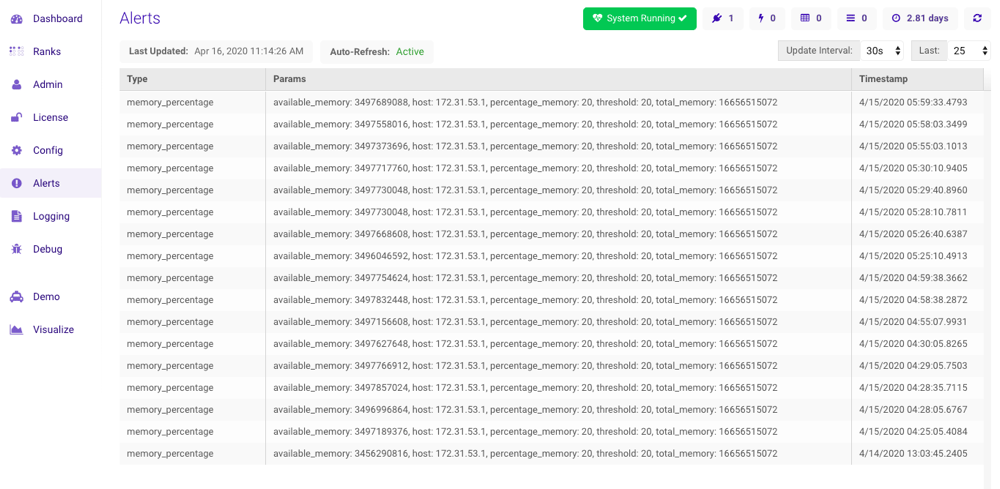
Logging
The Logging page displays the running system log file, updating every two seconds. This file is Kinetica’s main diagnostic tool and it is located at /opt/gpudb/core/logs/host-manager-<hostname>-<date-time>.log.If the cluster uses a shared persist directory, each nodes’ database log will
be located in this directory as well.
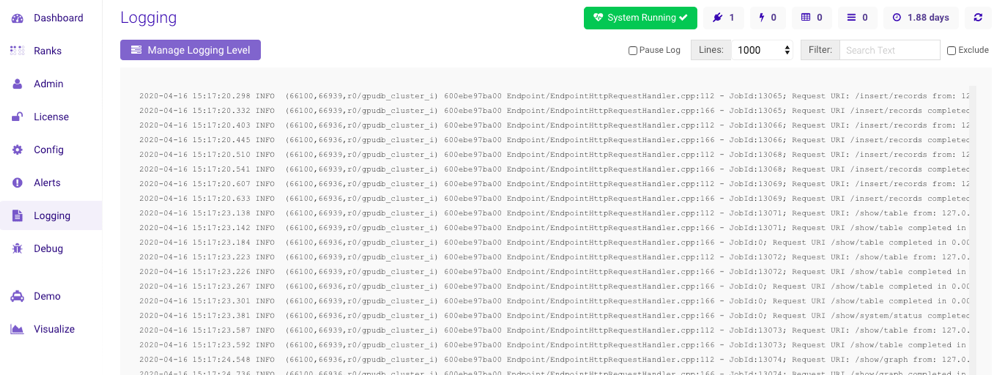
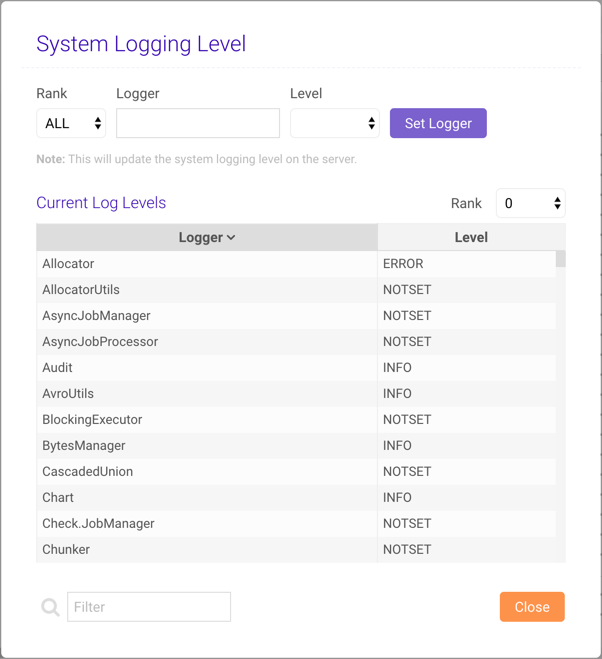
Setting Loggers
Click Manage Logging Level to open the Manage System Logging Level window, where the per-rank logging level for any system logger can be modified. To view the active loggers and corresponding levels for each rank, select the rank from the Rank drop-down menu above the Current Log Levels list. Use the Filter below the list to find a particular logger in the list. To update a logger:- At the top of the window, select a rank or ALL from the Rank drop-down window.
- Provide a logger name for the Logger field.
- Select a logger level from the Level drop-down menu.
- Click Set Logger.
Debug
The Debug page displays debugging and metric information about your cluster. Note that each section has nested information, so it’s possible to drill in for more details. From this page, you can also generate system reports and access previous reports. A system report includes important logs and files that can be sent to support (support@kinetica.com) to help diagnose any issues at hand.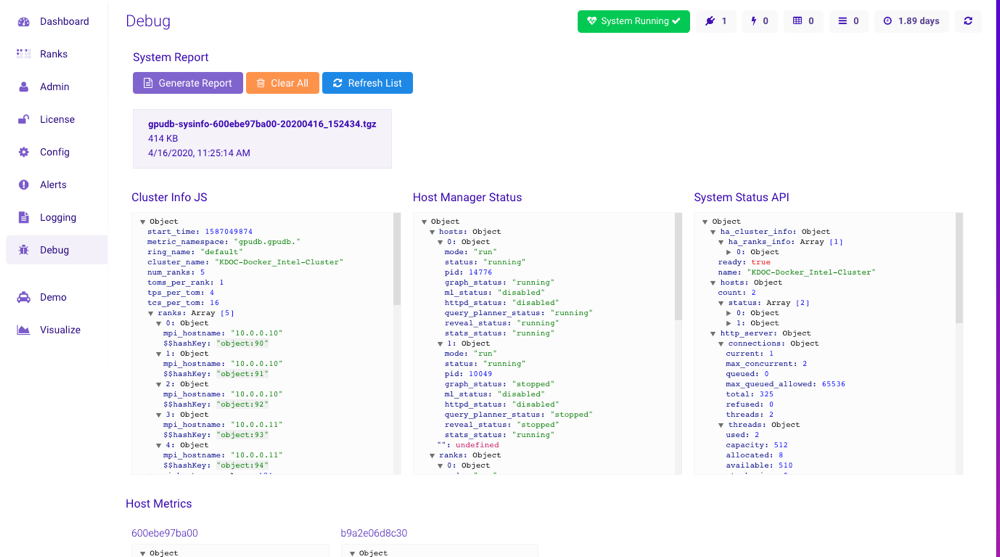
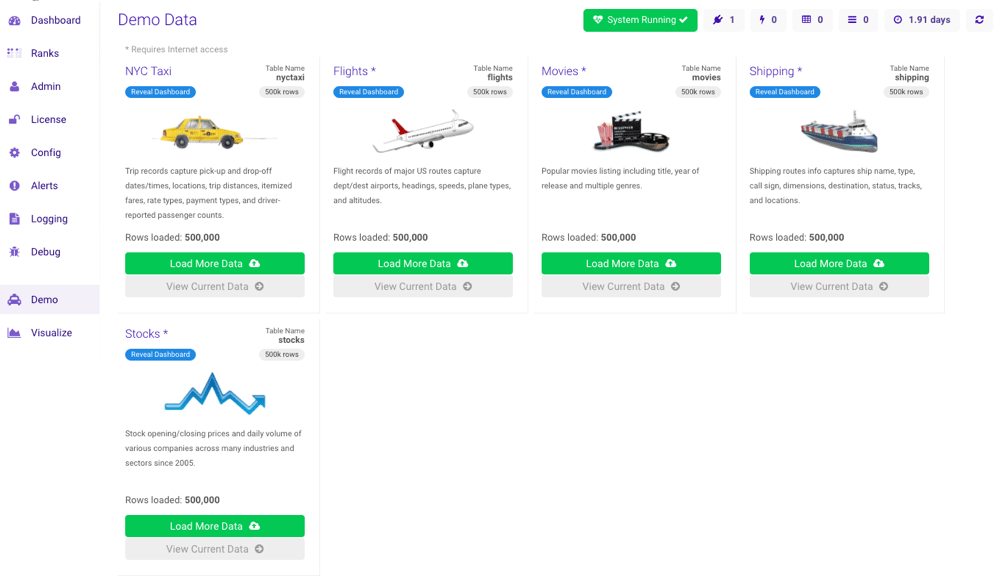
Demo
The Cluster —> Demo section is only available to users
with the System Admin permission.
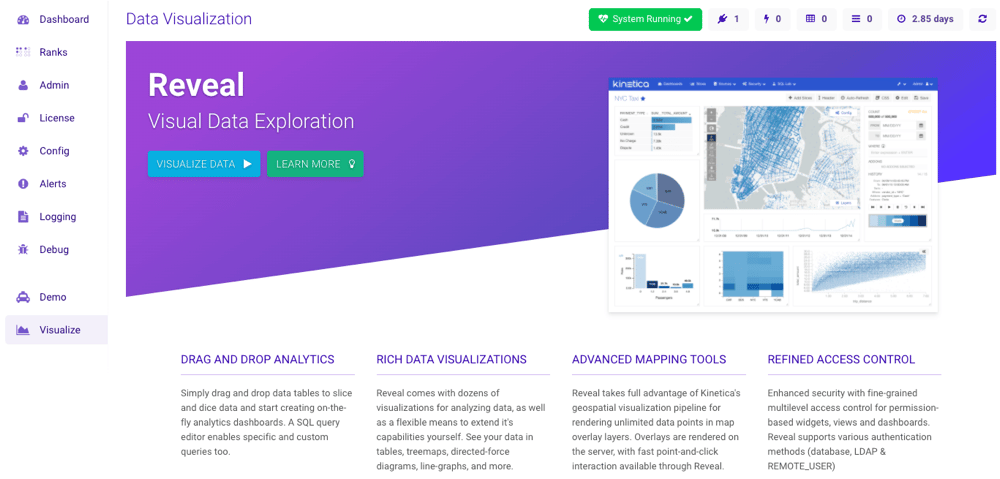
Visualize
The Visualize page contains an overview of Reveal as well as a quick link to Reveal.