Cluster
The Cluster menu selection comprises several tabs that contain information about all the machines in your cluster as well as configuration and log file access.
Summary data about your Kinetica cluster is pinned to the top right of each tab within Cluster; it includes:
- The status of Kinetica
- How many users are connected to Kinetica
- How many requests per second are being made to Kinetica
- How many tables are present in this Kinetica cluster
- How many objects are present in this Kinetica cluster
- The uptime of this Kinetica cluster
- A refresh button to refresh the cluster information

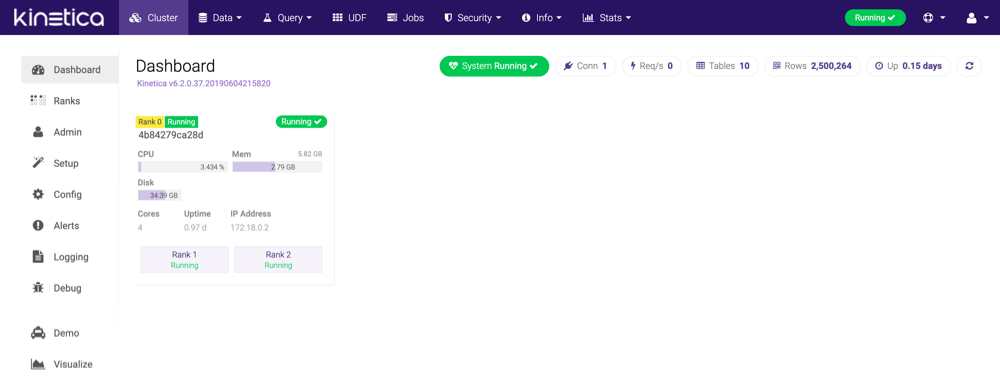
Dashboard
The Dashboard page is also the GAdmin homepage. It highlights the most important information about all the machines in your cluster, including CPU, Memory, and Disk usage.
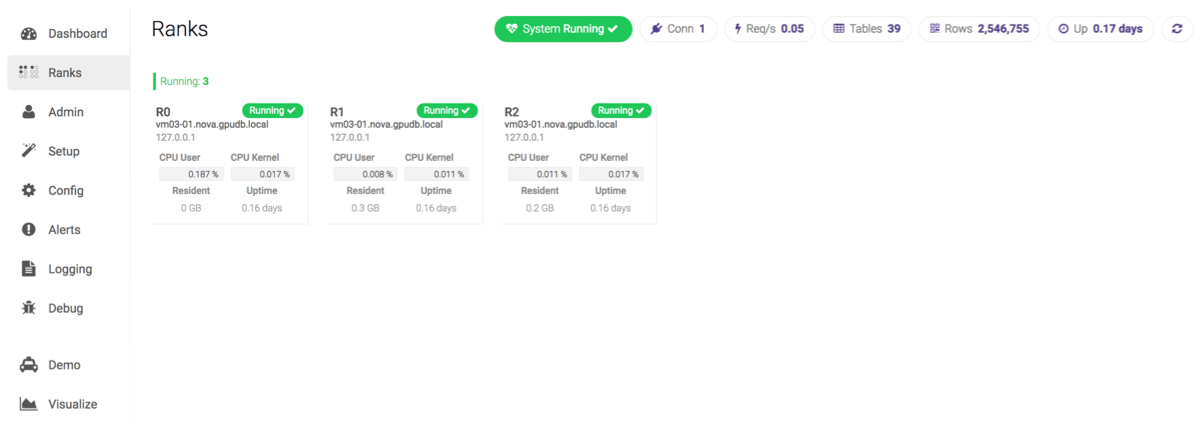
Ranks
The Ranks page displays important information about all the GPU ranks being used in your cluster.
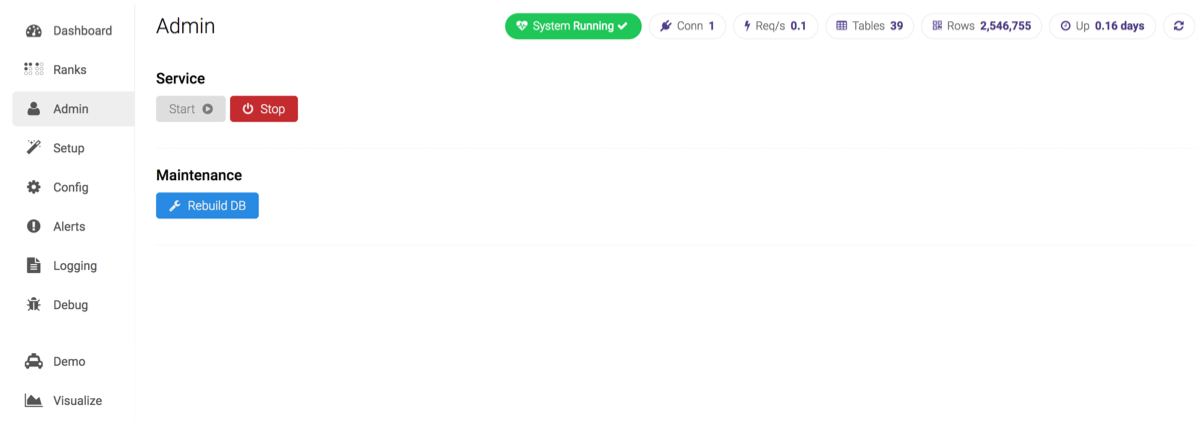
Admin
The Admin page allows you to stop or start the GAdmin service. The entire database can be rebuilt from here as well should you experience database errors or some tables and/or collections are unable to be queried. All tables or just tables with disk optimized columns and/or tables with text search columns can be rebuilt. For more information on rebuilding individual tables or collections, see Rebuilding.
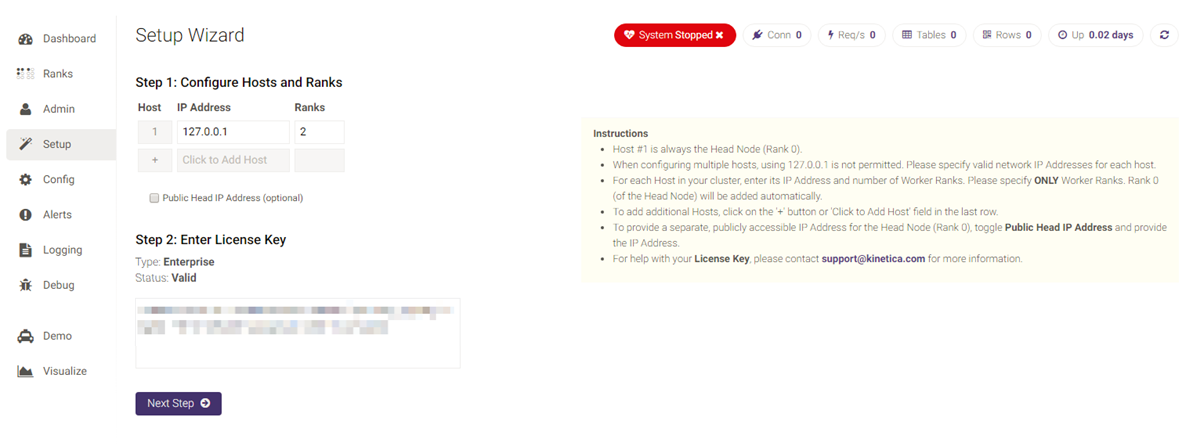
Setup
The Setup page assists in first-time setup for Kinetica, including host, rank, and license key input. The settings on this page vary depending on license type (Cloud, Enterprise, etc.) and package type (CUDA or non-CUDA).
Important
This tab can only be edited when Kinetica is not running.
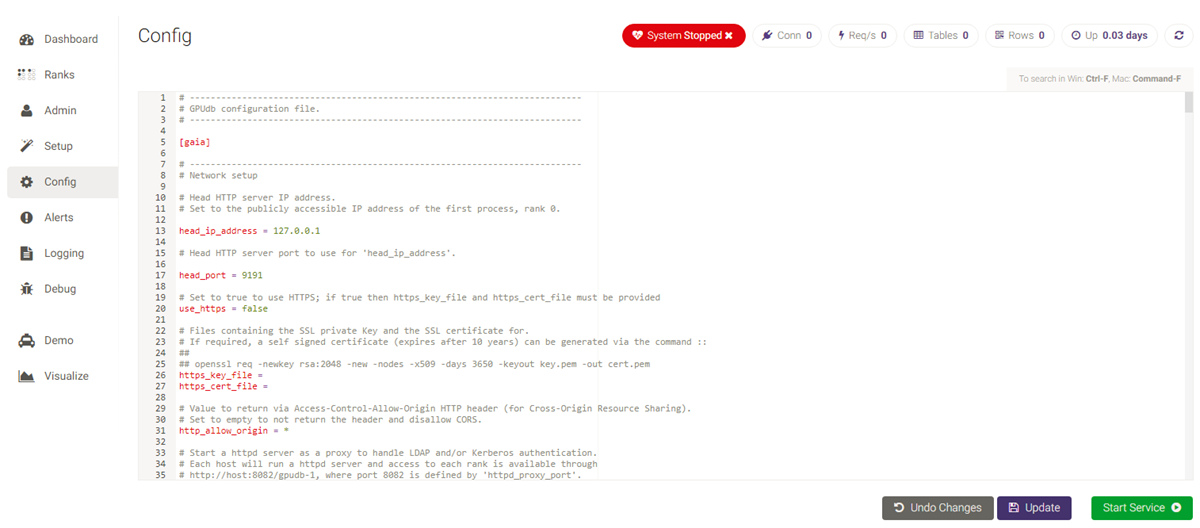
Config
The Config page allows you to edit the core Kinetica configuration
file and save the changes directly in GAdmin; this file maps
to the /opt/gpudb/core/etc/gpudb.conf file. Detailed
information about configuration file settings can be found on
Configuration Reference.
Important
This tab can only be edited when Kinetica is not running.
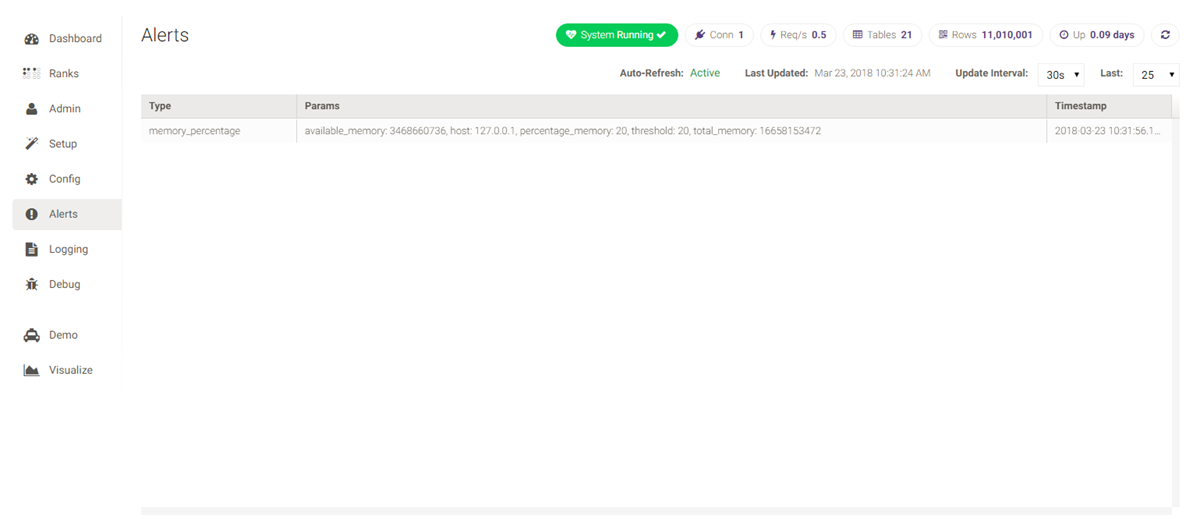
Alerts
The Alerts displays the most recent triggered alerts. Detailed information about alerts and how to set them can be found on Alerting.
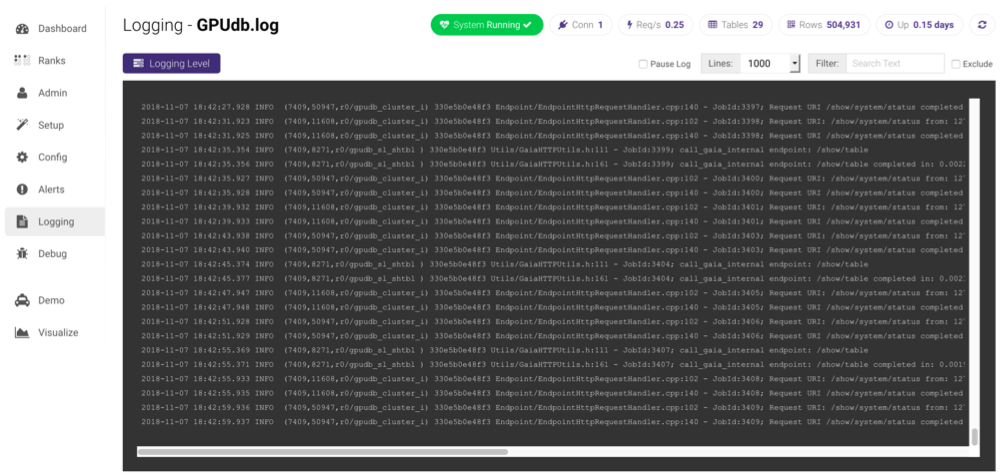
Logging
The Logging page displays the running gpudb.log file,
updating every two seconds. Select the Pause Log checkbox to pause
the gpudb.log file updates. The number of displayed lines can be
selected from Lines, and the displayed lines can be filtered using
Filter. Select Exclude to instead exclude the filtered
lines from the log.
Select Logging Level to modify the per-rank logging level for any system logger. Any change will take effect immediately and be in effect until a subsequent change is made to the same logger or the database is restarted. A database restart will reset all loggers to their default levels, system-wide.
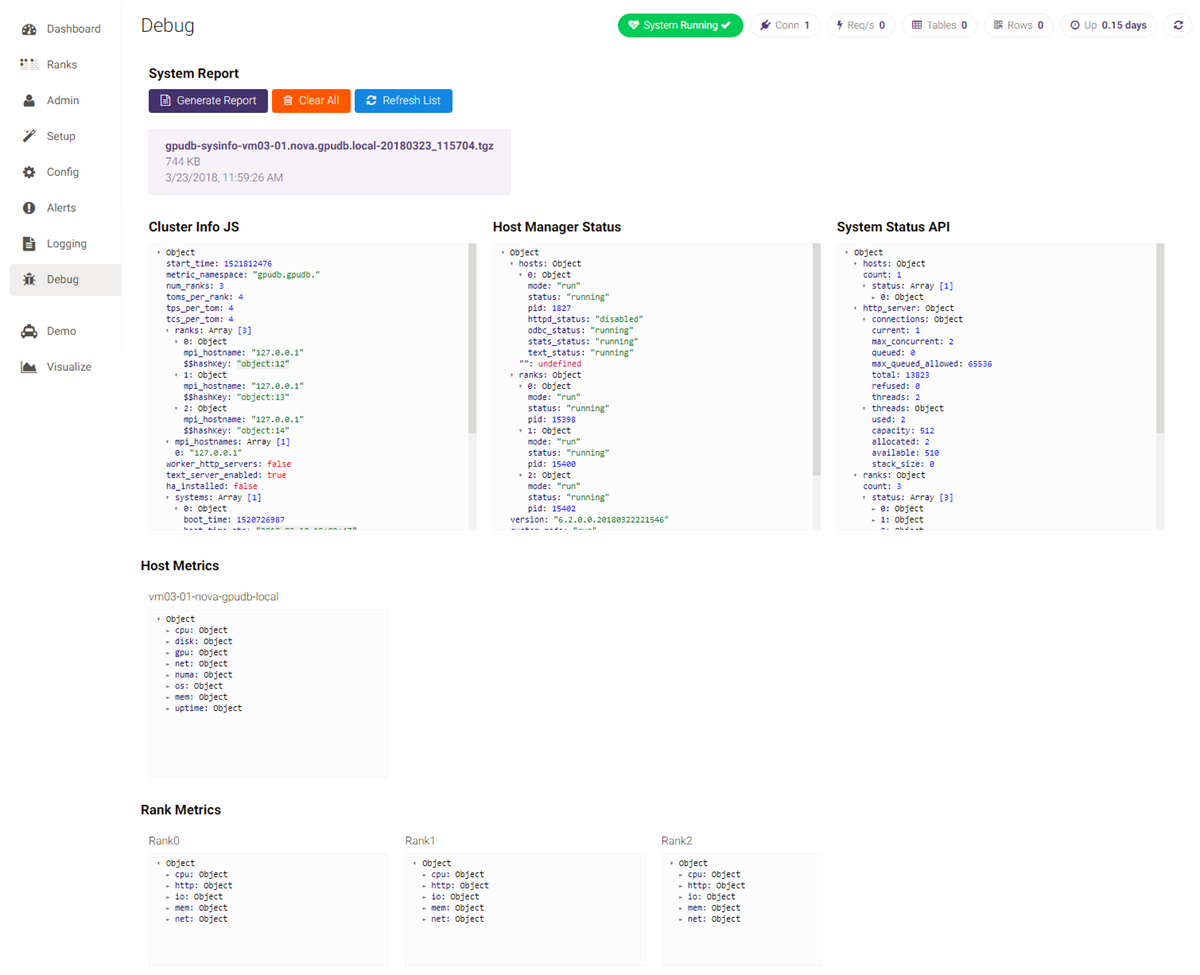
Debug
The Debug page displays debugging and metric information about your cluster. Note that each section has nested information, so it's possible to drill in for more details. From this page, you can also generate system reports and access previous reports. A system report includes important logs and files that can be sent to Support to help diagnose any issues at hand.
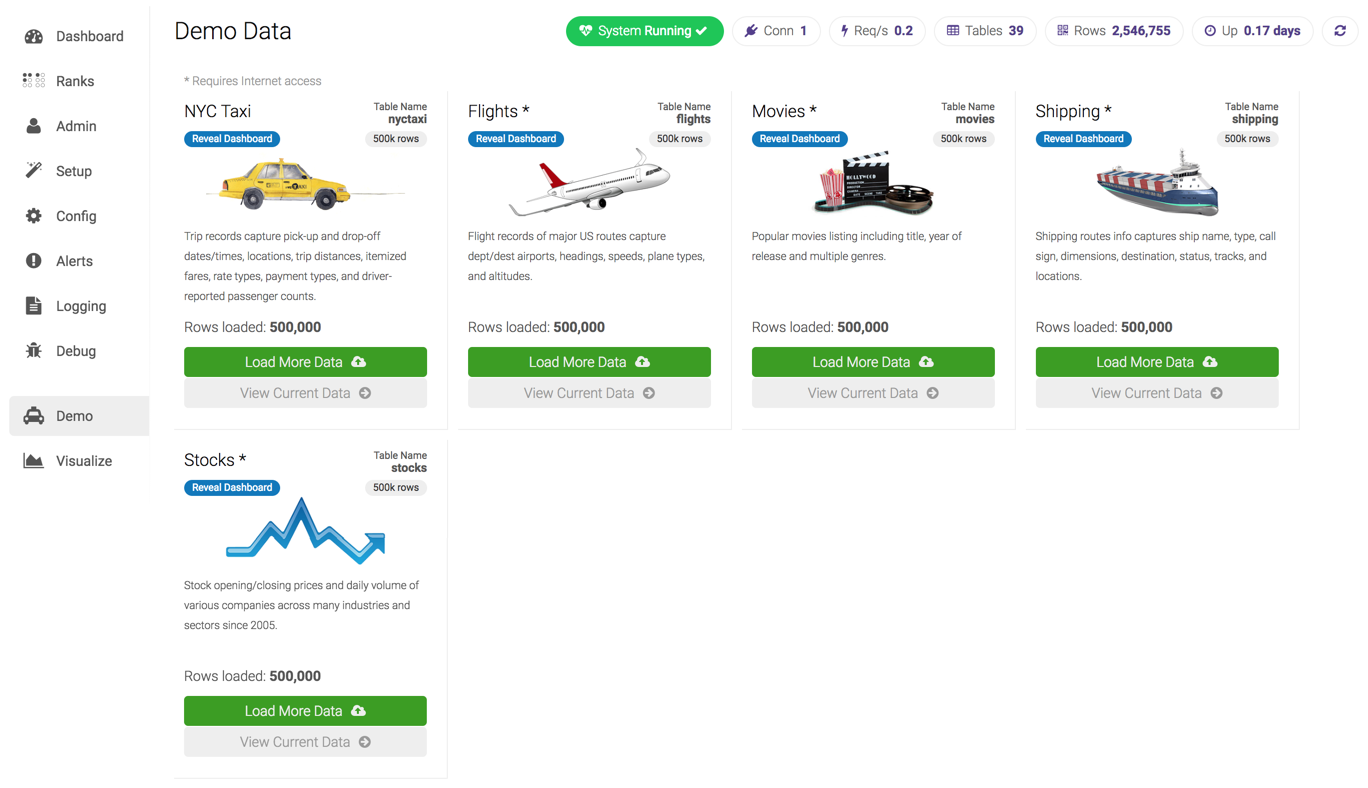
Demo
The Demo page contains various data that you can load into Kinetica. This data will help get you started using Kinetica as well as demonstrate some key capabilities of the system. Each demo dataset contains 500,000 records; after loading the data into Kinetica, you have the option of loading the same data again to increase the amount of data you have to play with. The datasets with a Reveal Dashboard button have a corresponding Reveal dashboard that will be automatically setup in Reveal after ingesting the data.