Dashboard
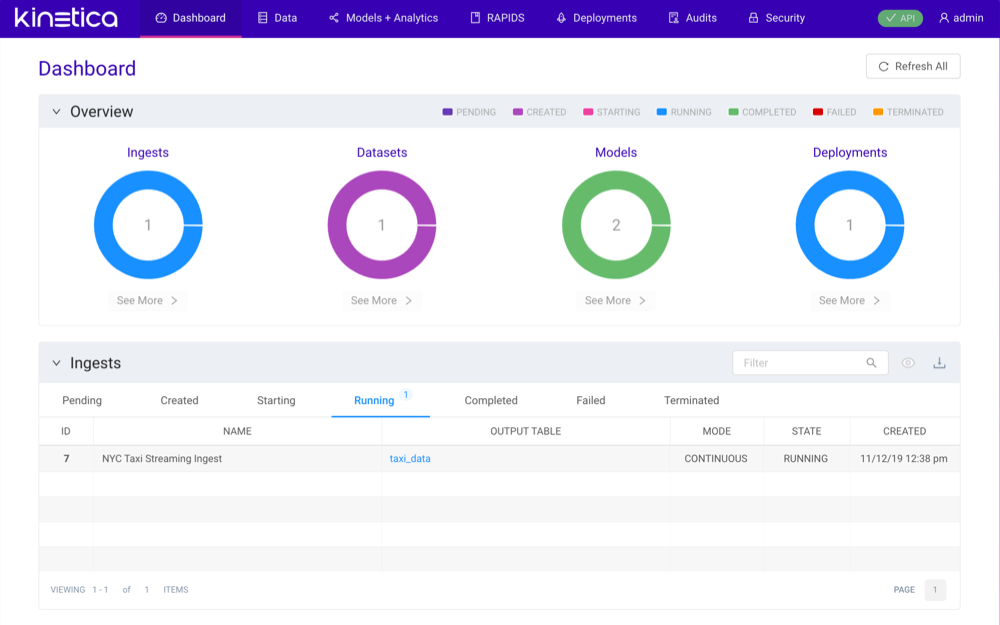
The Dashboard is the home page for the AAW user interface. It provides a detailed summary of all entities stored within AAW as well as their status. Click Refresh All to refresh the Overview graphs and the entity tables below.

The Overview displays a graph for each entity type: Ingests, Datasets, Models, and Deployments. Each graph is divided into portions that represent n entities that occupy one of six statuses. These statuses are the same for every entity but may mean different things for each entity. The statuses are as follows:
- Pending -- entity is defined and ready
- Created -- entity has been successfully created
- Starting -- the container to handle the eventually-running entity is deploying to the Kubernetes cluster
- Running -- entity job is running
- Completed -- entity job has completed
- Failed -- entity job has failed and exited
- Terminated -- entity job is stopped
Tip
Click See More to navigate directly to the entity's section in the AAW UI.

The rest of the Dashboard comprises a table for each entity.
- Type into Filter to filter down the entities in the desired table.
- Click one of the status tabs at the top of the table to filter by status.
- Click an entity to open its Details page.
- Click
 to any display archived entities.
 - Click
 to export the entity table's values as JSON or CSV.
Note
If there are no entities of a given type available, an Add <entity> button will be displayed in the table
