Stats
Detailed statistics about the Kinetica cluster can be accessed under the Stats menu.
Important
The Stats section is only available to users with the System Admin permission.
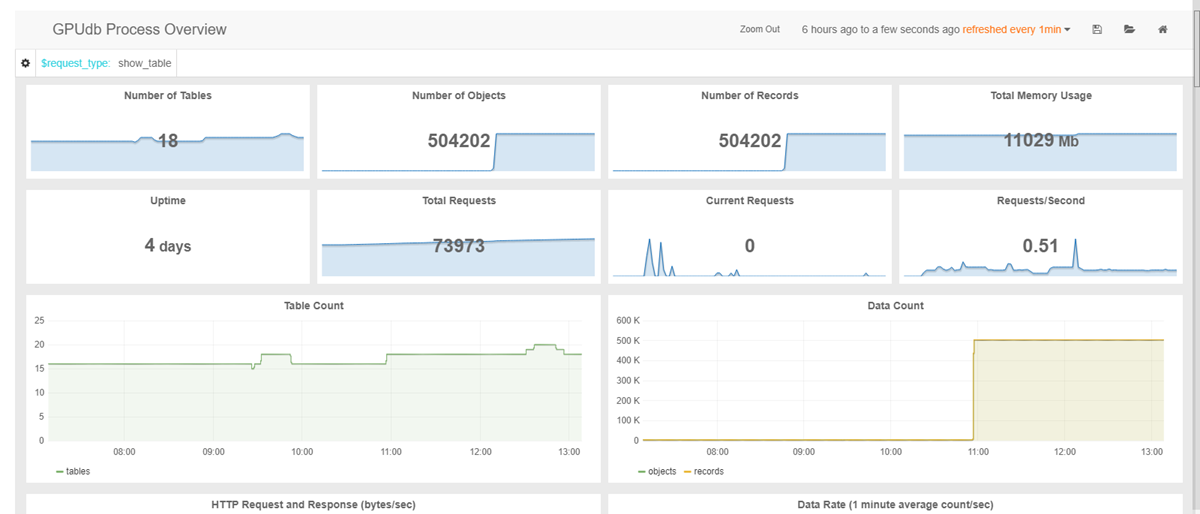
Kinetica Overview
This page is home to metrics related to the performance and health of your Kinetica instance.
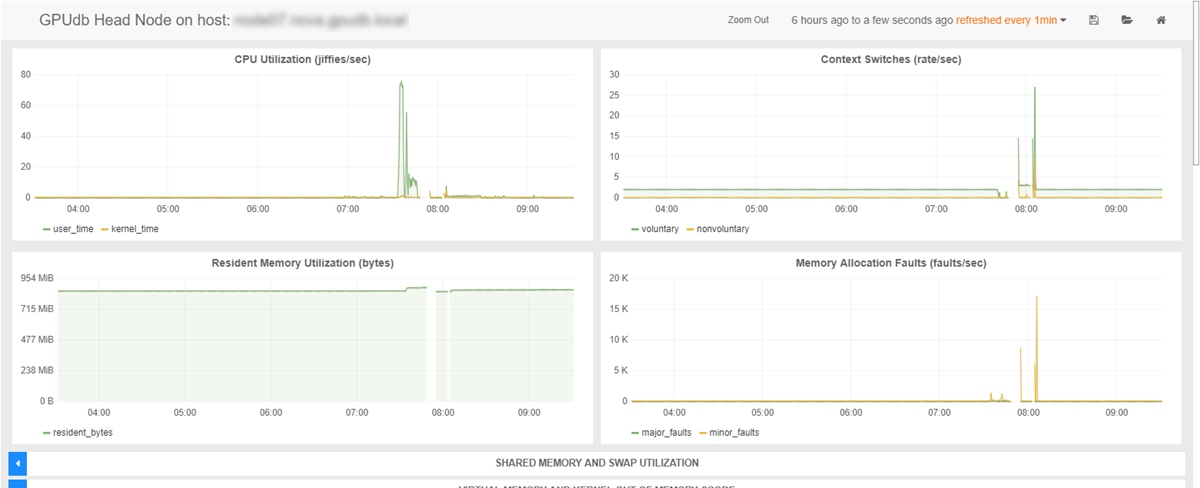
Another set of various Kinetica overview metrics is also available for each individual node in your cluster, e.g., your head Kinetica node and any workers.
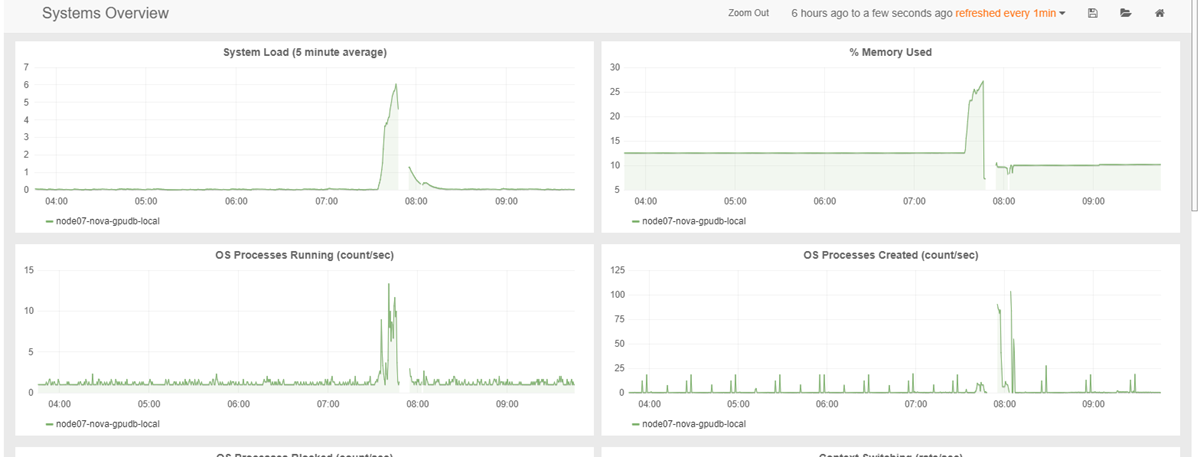
Systems Overview
This page is home to metrics related to the machines Kinetica is installed on.
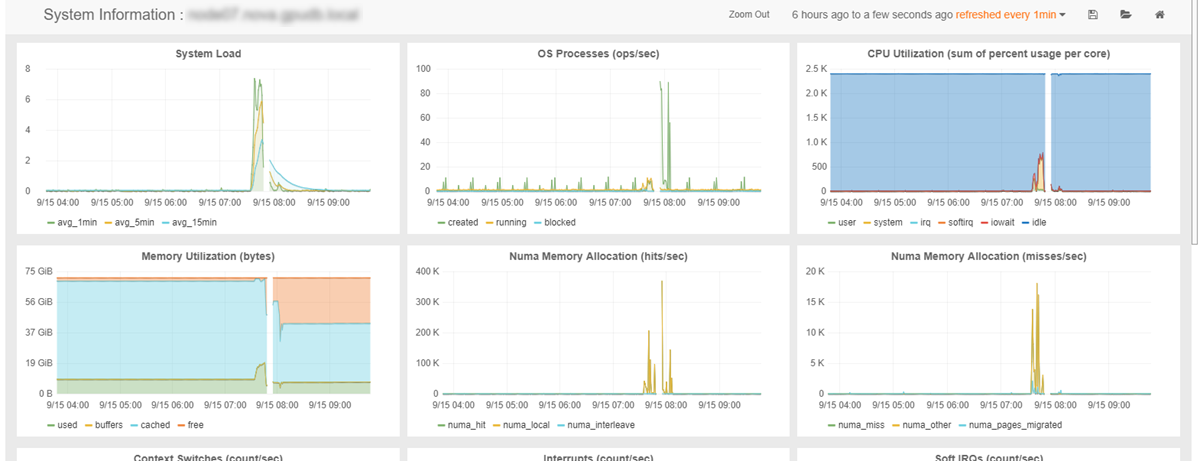
Similarly to the Kinetica overview metrics, another set of various system metrics is also available for each host Kinetica is installed on.
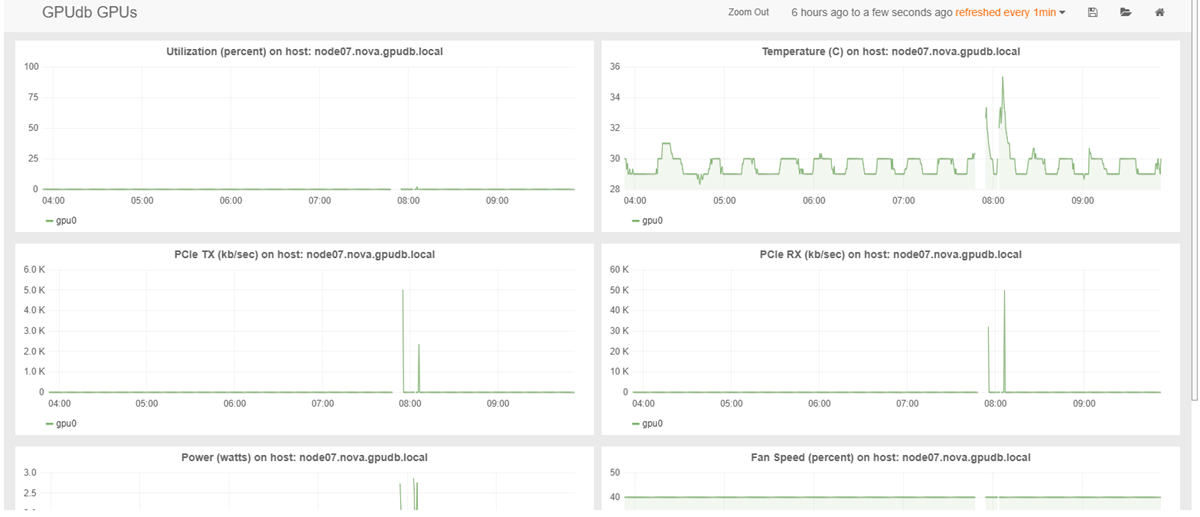
GPU Overview
This page is home to metrics related to the performance and health of your GPUs (if applicable).
Builder
You can use the Builder functionality to customize a dashboard with metrics that fit your specific needs. Many metrics are available, including system, Kinetica, and GPU performance metrics. Drill into the metrics tree, add them to the custom dashboard space, and customize the metric cards as desired using functions and render options. Once you've finished customizing the dashboard, you can save it to access it from Kinetica Stats at any time.