Upgrading Kinetica (KAgent - On Premise)
Kinetica version 7.0+ can be upgraded to the latest version using the KAgent cluster management UI. This page assumes that KAgent is installed and currently managing the cluster. KAgent will manage upgrading every node in a cluster as well as any configuration file merging.
KAgent Upgrade
Important
If Kinetica and KAgent are already the latest version, skip to Upgrading Database Clients.
Before upgrading Kinetica, KAgent should be upgraded to the latest version:
# RHEL
yum update kagent-<version>-0.x86_64

# Ubuntu
apt-get install kagent-<version>-0.x86_64
Cluster Upgrade
Once KAgent is upgraded to the latest version, the KAgent cluster management interface can be used to upgrade a given cluster:
Login to KAgent (
http://<kagent-host>:8081).Next to the cluster that should be upgraded, click Manage.
Click the Admin tab, then click the Upgrade sub-tab . KAgent will pull a list of versions available in the public Kinetica repository.
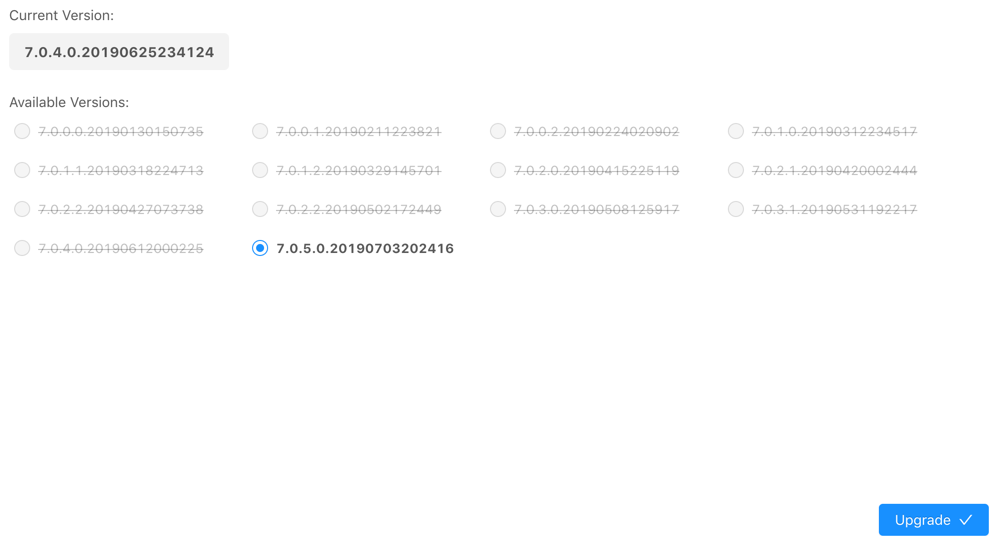
Select an Upgrade Mode:
Online:
- Select the desired version. It's recommended the latest version be selected.
- Click Upgrade. The upgrade may take a while as KAgent deploys an updated package on each node in the cluster.
Offline:
Upload a package file for each component or driver necessary for the upgrade.
Important
If performing an offline upgrade, all necessary dependencies will need to be installed/upgraded prior to cluster setup.
Click Upgrade. The upgrade may take a while as KAgent deploys an updated package on each node in the cluster.
Upgrading Database Clients
All native API clients and ODBC/JDBC drivers will need to be updated to be compatible with the database.
Native APIs
The instructions for upgrading to the latest APIs can be found in their respective manuals:
ODBC/JDBC
ODBC & JDBC drivers and related configuration will need to be updated.
Note
If using the Windows ODBC driver, be sure to remove older versions of the driver before installing new ones.
Remove Previous Windows ODBC Drivers
To remove the old drivers:
- Launch ODBC Data Source Administrator (64-bit or 32-bit, as needed).
- Select any entry with a Driver name of
Kinetica ODBC Driver. - Optionally, click the Configure button to open up the driver properties window and record any settings that could be reused with the new driver (username, SSL Certificate path, etc.).
- Click the Remove button.
- Click the Yes button to confirm the removal.
- Repeat this process until all older drivers have been removed.
Validation
To validate that Kinetica has been installed and started properly, you can perform the following tests.
Curl Test
To ensure that Kinetica has started (you may have to wait a moment while the system initializes), you can run curl on the head node to check if the server is responding and port is available with respect to any running firewalls:
$ curl localhost:9191
Kinetica is running!
API Test
You can also run a test to ensure that the API is responding properly. There is an admin simulator project in Python provided with the Python API, which pulls statistics from the Kinetica instance. Running this on the head node, you should see:
$ /opt/gpudb/bin/gpudb_python /opt/gpudb/kitools/gadmin_sim.py
Collection 'SYSTEM' child tables: 1 total elements: 1 total objects: 1
|
 --------Table 'ITER' elements: 1 objects: 1 ttl: -1 remaining ttl: -1 type id: UNSET_TYPE_ID label: ''
**********************
Total tables:              1
Total top-level tables:    0
Total collections:         1
Total number of elements:  1
Total number of objects:   1
GAdmin Status Check
The administrative interface itself can be used to validate that the system is functioning properly. Simply log into GAdmin. Browse to Dashboard to view the status of the overall system and Ranks to view the status breakdown by rank.
Ingest/Read Check
After verifying Kinetica has started and its components work, you should confirm ingesting and reading data works as expected.
- Navigate to the Demo tab on the Cluster page.
- Click Load Sample Data under the NYC Taxi section. Confirm the data loading.
- Once the data is finished loading, click View Loaded Data. The
data should be available in the
nyctaxitable located in theMASTERcollection.
If Reveal is enabled:
Navigate to:
http://<head-node-ip-address>:8088/
Log into Reveal and change the administration account's default password.
Click NYC Taxi under Dashboards. The default NYC Taxi dashboard should load.
Logging
The best way to troubleshoot any issues is by searching through the available logs. For more information on changing the format of the logs, see Custom Logging. Each component in Kinetica has its own log, the location of which is detailed below:
| Component | Log Location |
|---|---|
| Active Analytics Workbench (AAW) (API) | /opt/gpudb/kml/logs/ |
| Active Analytics Workbench (AAW) (UI) | /opt/gpudb/kml/ui/logs/ |
| GAdmin (Tomcat) | /opt/gpudb/tomcat/logs/ |
| Graph Server | /opt/gpudb/graph/logs/ |
| KAgent (Service) | /opt/gpudb/kagent/logs/ |
| KAgent (UI) | /opt/gpudb/kagent/ui/logs/ |
| Kinetica system logs | /opt/gpudb/core/logs/ |
| Reveal | /opt/gpudb/connector/reveal/logs/ |
| SQL Engine | /opt/gpudb/sql/logs/ |
| Stats Server | /opt/gpudb/stats/logs/ |
| Text Server | /opt/gpudb/text/logs/ |