Note
This documentation is for a prior release of Kinetica. For the latest documentation, click here.
Detailed statistics dashboards about Kinetica and its host(s) can be accessed under the Stats menu. Collected statistics are divided into four groups:
- Kinetica
- Tiered storage and resource groups
- System
- GPU (if the CUDA version of Kinetica is installed)
Important
The Stats section is only available to users with the System Admin permission.
Kinetica
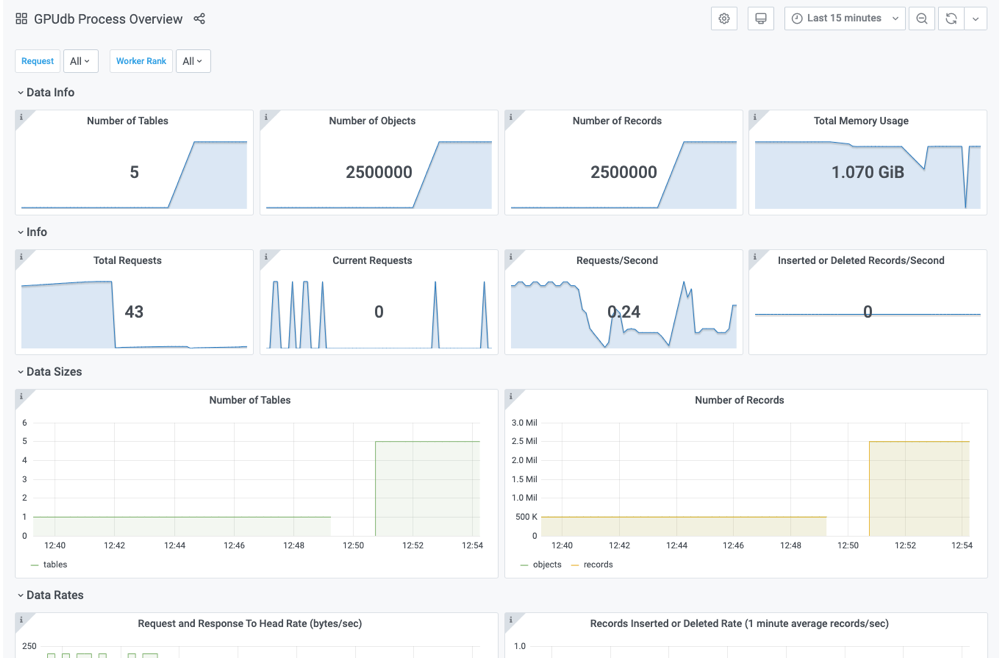
The Kinetica DB Overview dashboard is home to metrics related to the performance and health of your entire Kinetica instance. These metrics are also available on a per-processing-node basis for each node in your cluster, e.g., your head Kinetica node and any workers.
Tip
This dashboard (and some of the others) support viewing individual metrics via the drop-down menus in the top-left corner.
Tiered Storage and Resource Groups
The tiered storage and resource groups metrics are grouped into three stats dashboards:
- Memory Tiers -- metrics related to the memory-based storage tiers, e.g., VRAM and RAM
- File Backed Tiers -- metrics related to the file-backed storage tiers, e.g., Disk Cache, Persist, and Cold Storage
- Resource Groups -- metrics related to the resource groups that work within the database
Systems Overview
The Host Systems Overview dashboard is home to metrics related to the machine(s) Kinetica is installed on. These metrics are also available on a per-host basis for each node in your cluster.
GPU Overview
This dashboard is home to metrics related to the performance and health of your GPUs (if applicable).