Install Kinetica
There are several different options for installing Kinetica Enterprise or Kinetica in AWS. However, to get started within minutes (and for free) we recommend either of the following two routes:- Kinetica Cloud Free: This is a free managed version with 10 GB of storage, which is hosted in the cloud. Follow the instructions for Kinetica Cloud Free to create an account and launch Kinetica.
- Kinetica Developer Edition: The Developer Edition is a free personal copy of Kinetica that can be installed on your computer. It requires Docker and 8 GB of RAM. Follow the instructions for Kinetica Developer Edition to install Developer Edition.
Workbench with Integrated SQL GPT
Workbench is the primary interface for querying and managing Kinetica.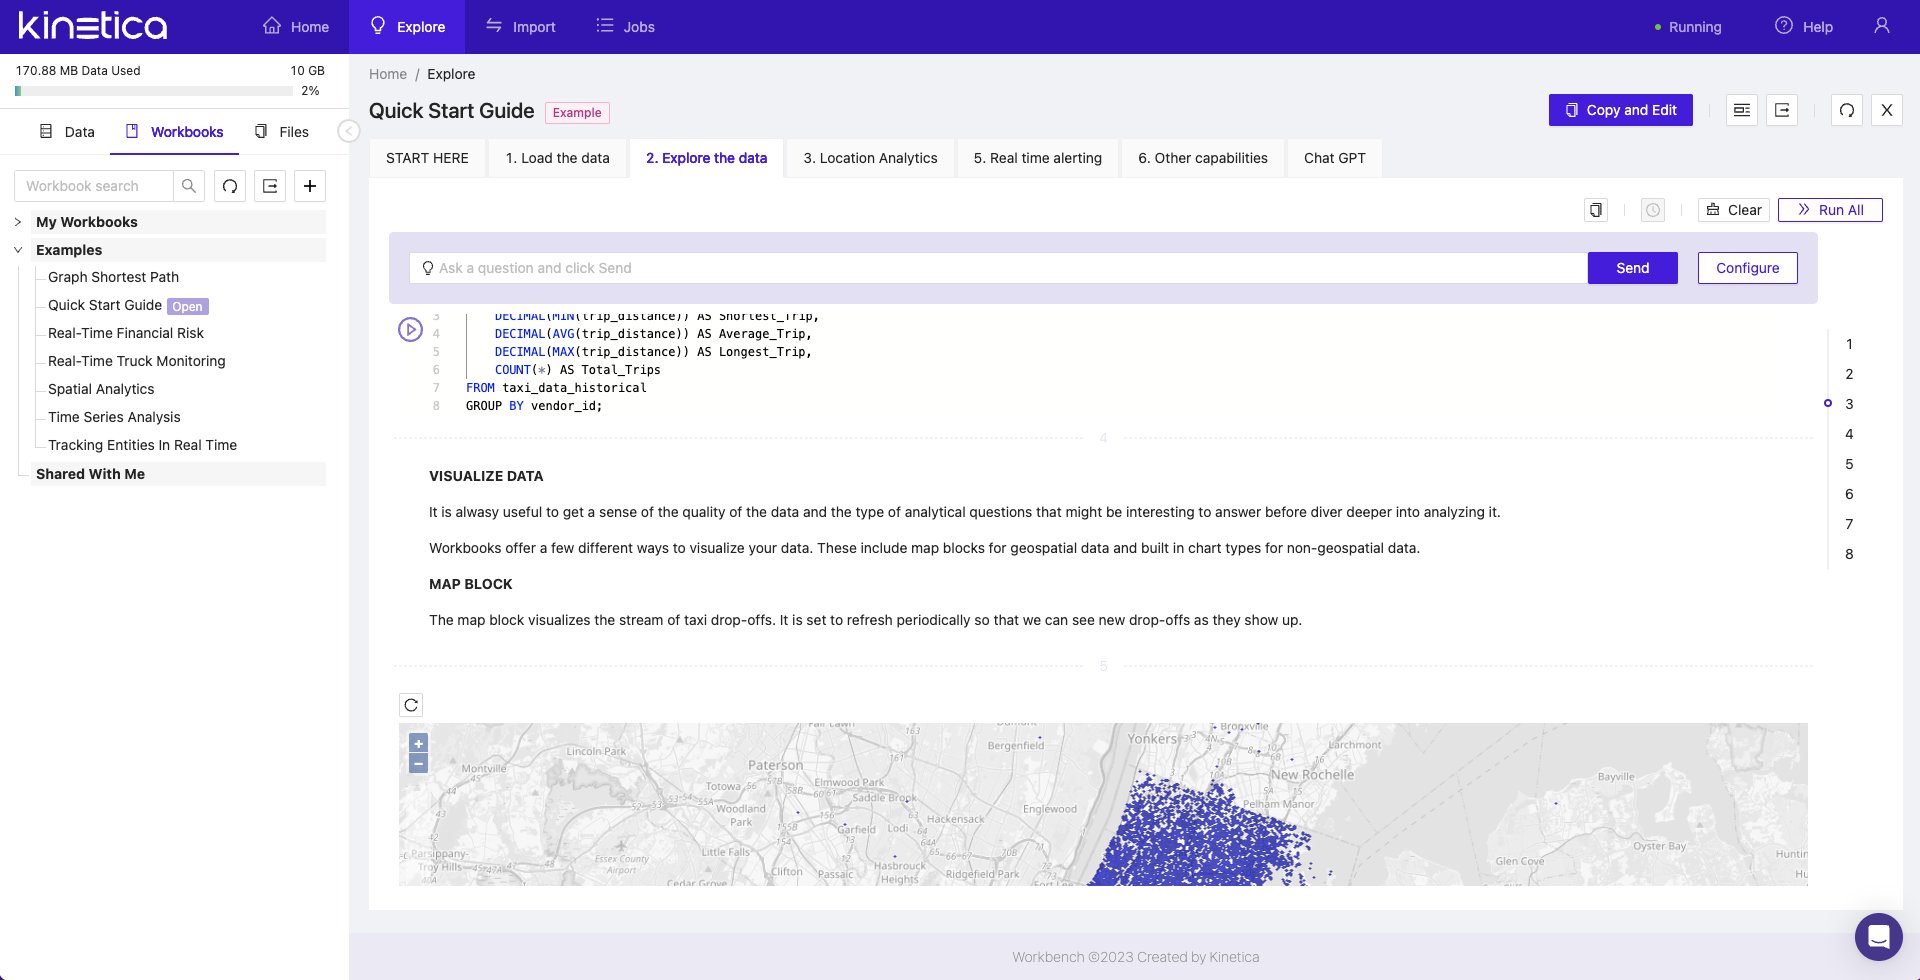
- Kinetica Cloud Free: Workbench will be the interface presented when logging in.
-
Kinetica Developer Edition: Log into Workbench once you have installed
Kinetica at:
- Clicking on the Quick Start Guide card under Getting Started
- Clicking on the Workbooks tab in the left navigation pane, and then on Quick Start Guide in the list of Examples