Note
This documentation is for a prior release of Kinetica. For the latest documentation, click here.
Reveal is a visual data exploration and insight discovery tool. It allows users who may or may not have extensive experience with big data or data analysis to quickly build charts and graphs in a meaningful way to explore their dataset. Reveal was designed to be interactive and easy to use.
Reveal is a Python Flask web application with a mostly React frontend. By default, it uses SQLite as its application data storage engine. To begin visualizing data, Reveal must first be connected to your RDBMS datastore. While Reveal can and does work with other flavors of databases, it is most powerful when connected to Kinetica. Kinetica allows this through a custom ODBC driver/connector via Reveal's SQLAlchemy interface.
Note
Reveal can be accessed via:
- http://<db.host>:8088/ (non-SSL)
- https://<db.host>:8444/ (SSL)
Features
- A rich set of charts, diagrams, and map visualizations based on industry standards such as D3 and OpenLayers
- Custom dashboards and sharing with other users
- Fine-grained security model allowing creation of custom roles with specific user permissions to features and datasets.
- Intuitive and easy-to-use data exploration tool to experiment with various visualizations and parameters to create insightful charts. Selecting columns, aggregations, and metrics is as simple as using dropdowns.
- SQL Lab tool allows users to interact directly with their datasets via direct SQL statements.
Security
Reveal allows for unlimited number of user accounts, each with their own roles and permissions. All user logins and feature/data accesses are logged in the Action Log for audit purposes. It is implemented via Flask AppBuilder (FAB), which provides all the aforementioned features.
For details on configuring security within Reveal, see Reveal User/Role Management.
For details on configuring Reveal in a secure environment, see the HTTPD + SSL section of Security Configuration.
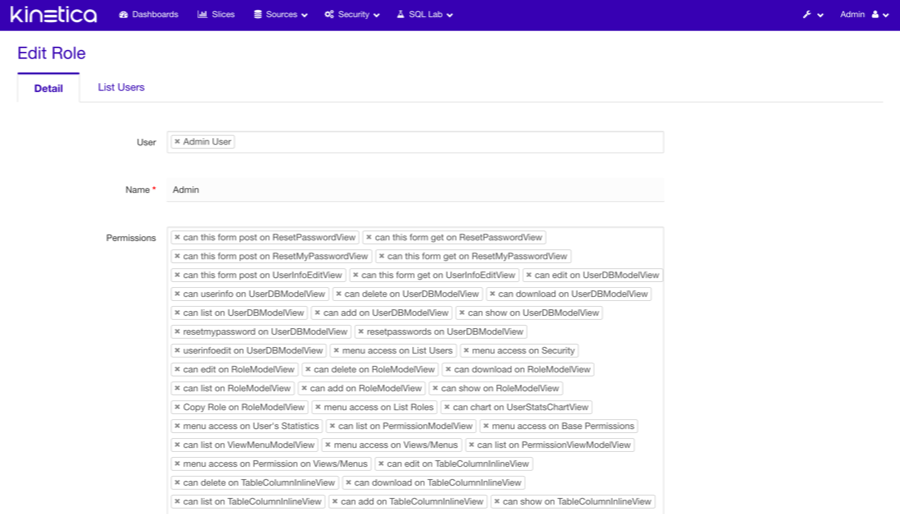
Roles/Permissions
By default, Reveal is installed with several roles ranging from full admin rights to public view-only. However, it is very easy to create custom roles with specific sets of permissions. You'll notice that the permissions framework is fine-grained and gives complete control over access to the application.
Each role associates a set of permissions with one or more users, and each user can be assigned one or more roles for access. This allows for roles to be constructed based on the type of user, containing all necessary permissions for that type; or roles can be constructed with logical groupings of features, and several of these feature roles can be assigned to each user. Reveal provides flexibility in designing the security model.
Datasources
Datasources represent all the sources of data to which Reveal has access. Not only can Reveal be connected to multiple databases, it can also be connected to databases of different types simultaneously.
Databases
Reveal should have the Kinetica database already added. Adding other databases is as simple as providing a name and the appropriate SQLAlchemy URI connection string for that type of database. Several options are available, such as exposing the database to SQL Lab and allowing synchronous and/or asynchronous queries to be executed on the database.
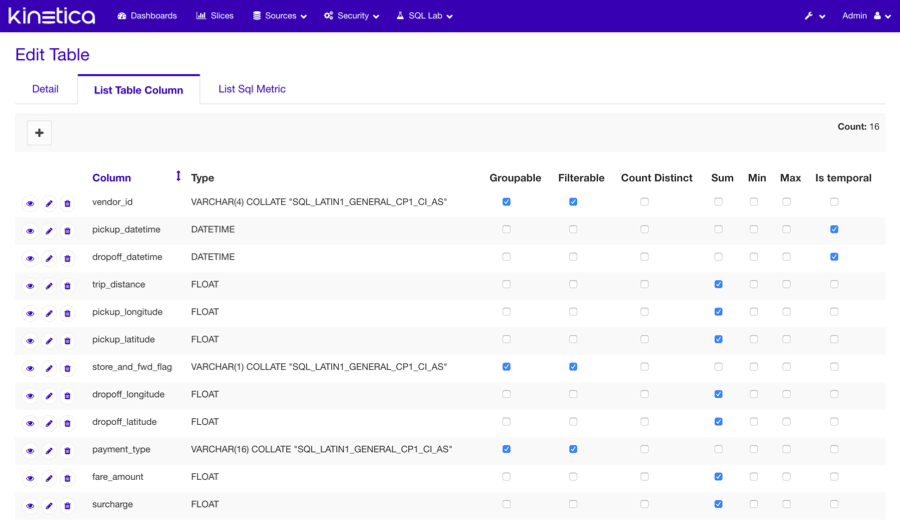
Tables
To explore data, specific table(s) from the connected database(s) must be added to Reveal. "Adding" a table simply makes Reveal aware of the table and allows for the addition of custom configurations and other metadata that will help in creating visualizations. Adding a new table is as easy as providing the table and database name.
Configuring a table, on the other hand, will sometimes require a little bit more effort, simply because the Reveal platform is so powerful. Reveal allows for additional configuration of its columns and also aggregates/metrics. For example, table columns can be designated as groupable, filterable, and/or countable. Custom metrics can be added of types count, sum, and/or avg, to name a few. Fortunately, upon first initialization of tables in Reveal, a lot of the columns will be preconfigured based on their datatypes. A few useful metrics will also have been added for the user.
Slices
A slice represents a specific view on data, whether it be a chart, map, or even text. But simply put, they are the visualizations or widgets the user will be creating and adding to their dashboards. Each slice is only connected to a single table and a single chart type. This simplicity is the basis for the platform which encourages creating as many slices as you need and mixing and matching them in multiple dashboards, each providing different insights.
A filter slice can be used to set a default date/time filter for a dashboard. When applied, any dashboard that is opened will automatically be filtered on the range specified. Ranges can be either fixed (02/02/2022 - 02/03/2022) or relative (5 days ago - now). Users can also expand the range after the dashboard is loaded. This is useful for situations where a dashboard is backed by very large base tables, but only a smaller set is needed on a regular basis.
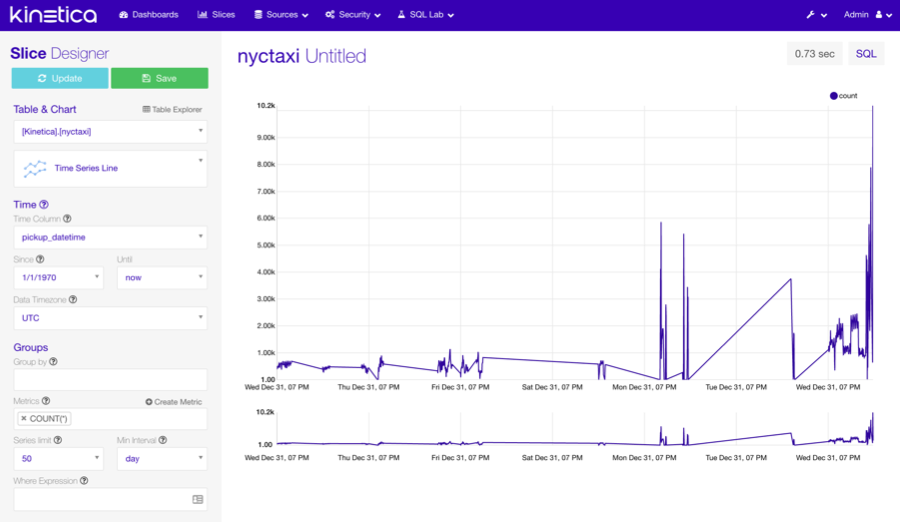
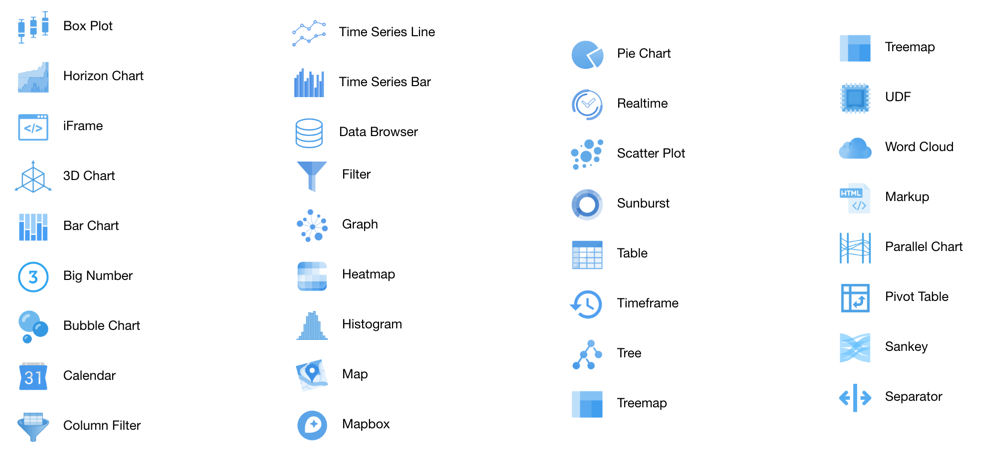
Chart Types
Reveal comes bundled with many useful types of visualizations that should cover most common use cases. Each type requires custom configuration based on how they visualize data. Not only will the slices display independently in dashboards, cross-filtering can also be applied across various slices in the dashboard.
The Reveal SDK can be used to create custom chart types to support custom slices.
Dashboards
The dashboard is, in a sense, the "final" product that is consumed by users of Reveal. All previous steps make the dashboard possible. The dashboard is a mix and match of all the slices available to the user. Slices can be added, positioned, sized, and arranged in any way desired. Dashboards can be shared with other users that have access.
Dashboards can be loaded from external files using SQL.
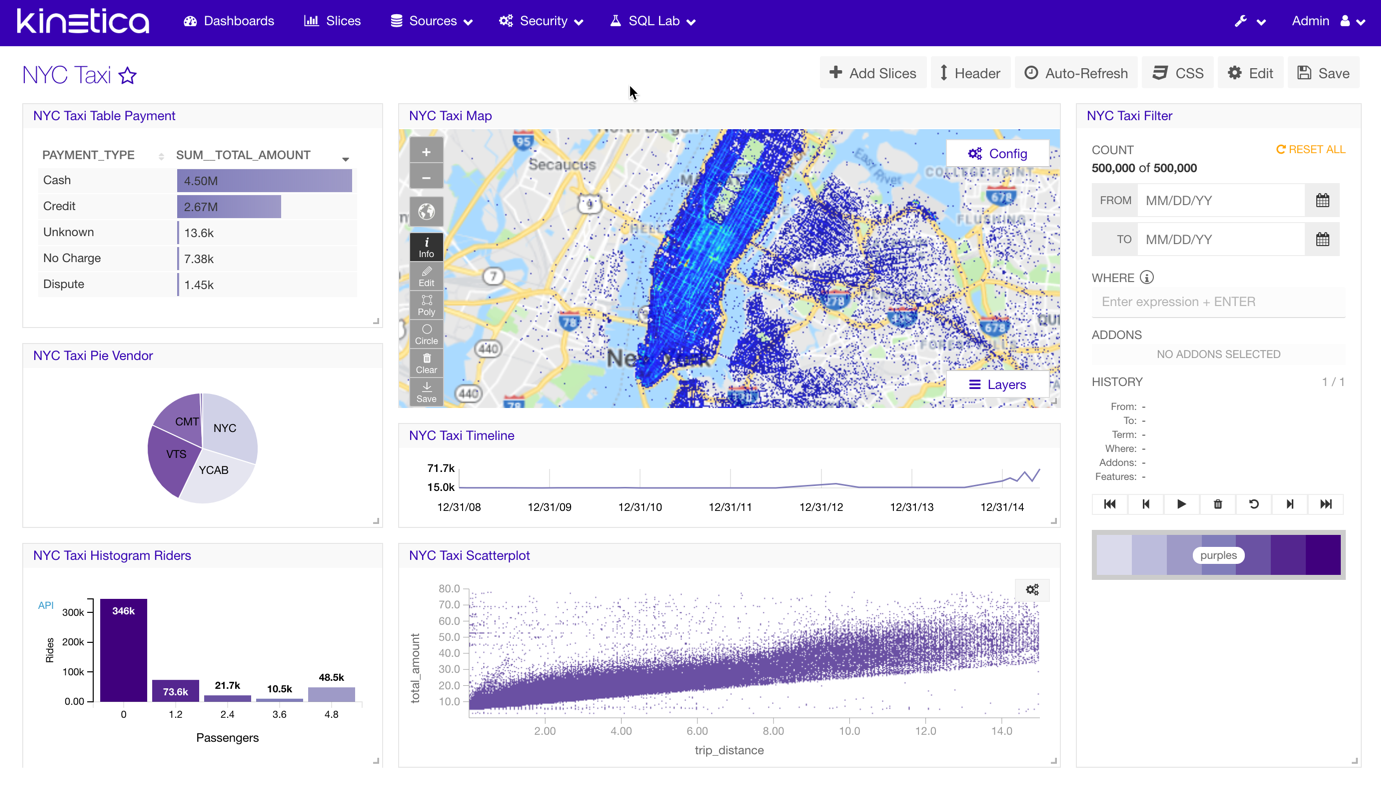
Cross-Filtering
To enable cross-filtering, the Filter slice must be included in the dashboard. The Filter slice acts as an agent that manages flow and communication of data between all the other slices in the dashboard. It is also responsible for filtering history, caching, and state management. Some of the other chart types are also interactive in the sense that they themselves can trigger a filter which will be applied to the dashboard. For example, clicking on a section of a Pie Chart will apply a filter for the value of that section.
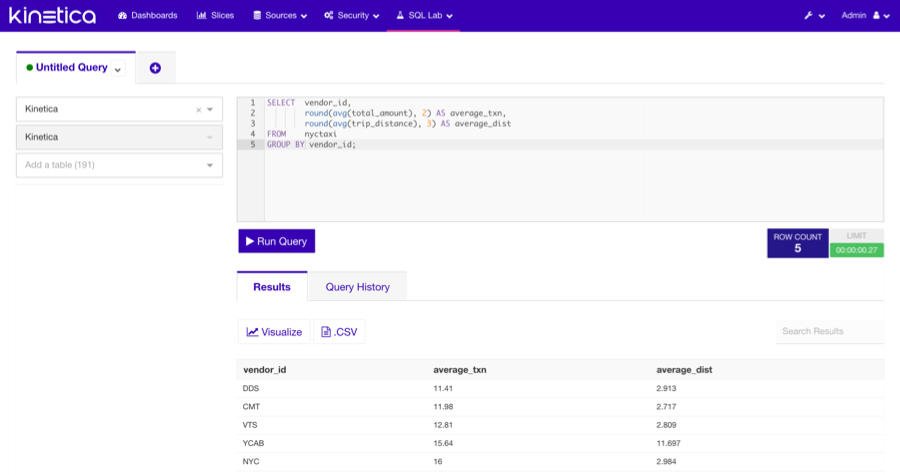
SQL Lab
SQL Lab is simply a SQL IDE provided in Reveal that allows users to directly interact with their data via SQL statements. Several additional features include:
- Multi-tab environment, which enables working with many queries simultaneously
- Browseable metadata of the database: tables, columns, indexes, and partitions
- Query history, which records previously executed queries and their statistics
Reveal in an iFrame
In order to run Reveal from within an inline frame:
Uncomment the session cookie settings in the Reveal /opt/gpudb/connectors/reveal/etc/config.py configuration file:
# Enable for embedding inside iframe
# by setting SECURE to True and SAMESITE to 'None'
SESSION_COOKIE_HTTPONLY = True
SESSION_COOKIE_SECURE = True
SESSION_COOKIE_SAMESITE = 'None'
Restart Reveal:
/opt/gpudb/core/bin/gpudb reveal-restart