Solve Graph - Multiple Routing (NYC Taxi)
The following is a complete example, using the Python API, of solving a graph created with NYC Taxi data for a multiple routing problem via the /solve/graph endpoint. For more information on Network Graphs & Solvers, see Network Graphs & Solvers Concepts.
Prerequisites
The prerequisites for running the multiple routing solve graph example are listed below:
- Kinetica (v.
7.0or later) - Graph server enabled
- Python API
Solve graph script- NYC Taxi dataset ingested (see Demo for more information)
NYC Neighborhood CSV file
Python API Installation
The native Kinetica Python API is accessible through the following means:
- For development on the Kinetica server:
- For development not on the Kinetica server:
Kinetica RPM
In default Kinetica installations, the native Python API is located in the
/opt/gpudb/api/python directory. The
/opt/gpudb/bin/gpudb_python wrapper script is provided, which sets the
execution environment appropriately.
Test the installation:
/opt/gpudb/bin/gpudb_python /opt/gpudb/api/python/examples/example.py
Important
When developing on the Kinetica server, use /opt/gpudb/bin/gpudb_python to run Python programs and /opt/gpudb/bin/gpudb_pip to install dependent libraries.
Git
In the desired directory, run the following but be sure to replace
<kinetica-version>with the name of the installed Kinetica version, e.g.,v7.0:git clone -b release/<kinetica-version> --single-branch https://github.com/kineticadb/kinetica-api-python.git
Change directory into the newly downloaded repository:
cd kinetica-api-pythonIn the root directory of the unzipped repository, install the Kinetica API:
sudo python setup.py install
Test the installation (Python 2.7 (or greater) is necessary for running the API example):
python examples/example.py
PyPI
The Python package manager, pip, is required to install the API from PyPI.
Install the API:
pip install gpudb --upgrade
Test the installation:
python -c "import gpudb;print('Import Successful')"
If Import Successful is displayed, the API has been installed as is ready for use.
Data File
The example script makes reference to a nyc_neighborhood.csv data file
in the current directory. This can be updated to point to a valid path on the
host where the file will be located, or the script can be run with the data
file in the current directory.
CSV = "nyc_neighborhood.csv"
Script Detail
This example is going to demonstrate solving for the quickest route between a given set of taxi trip endpoints. The trips are composed of a pickup and dropoff point, with each trip weighted based on how expensive it was.
Constants
Several constants are defined at the beginning of the script:
HOST/PORT-- host and port values for the databaseOPTION_NO_ERROR-- reference to a /clear/table option for ease of use and repeatabilityTABLE_NYC_N-- the name of the table into which the NYC Neighborhood dataset is loaded. This dataset is joined to theTABLE_TAXItable to create theJOIN_TAXIdataset.TABLE_TAXI-- the name of the table into which the NYC taxi dataset is loaded. This dataset is joined to theTABLE_NYC_Ntable to create theJOIN_TAXIdataset.TABLE_TAXI_EW-- the name of the projection derived from theJOIN_TAXIdataset that serves as the base dataset for theGRAPH_Tgraph.JOIN_TAXI-- the name of the join view that represents the dataset of all the trips found in theTABLE_TAXIdataset that overlap with the neighborhood boundaries found in theTABLE_NYC_NdatasetGRAPH_T-- the NYC taxi graphGRAPH_T_MRSOLVED-- the solved NYC taxi graph using theMULTIPLE_ROUTINGsolver type
HOST = "127.0.0.1"
PORT = "9191"

OPTION_NO_ERROR = {"no_error_if_not_exists": "true"}

TABLE_NYC_N = "nyc_neighborhood"
TABLE_TAXI = "nyctaxi"
TABLE_TAXI_EW = TABLE_TAXI + "_edges_weights_wkt"

JOIN_TAXI = "taxi_tables_joined"

GRAPH_T = TABLE_TAXI + "_graph_wkt"
GRAPH_T_MRSOLVED = GRAPH_T + "_multiple_routing_solved"
Graph Creation
One graph is used for this example: nyctaxi_graph_wkt, a graph utilizing
WKT based on a modified version of the standard NYC Taxi dataset included
with Kinetica installations.
To filter out data that could skew graph nyctaxi_graph_wkt, the
NYC Neighborhood dataset must be inserted into Kinetica and joined to the
NYC Taxi dataset using STXY_CONTAINS to remove any trip points in the NYC
Taxi dataset that are not contained within the geospatial boundaries of the
NYC Neighborhood dataset:
print(
    "Joining {} to {} to filter out data that could skew the taxi "
    "graphs.".format(TABLE_TAXI, JOIN_TAXI)
)
join_taxi_tables_response = kinetica.create_join_table(
    join_table_name=JOIN_TAXI,
    table_names=[TABLE_TAXI + " as t", TABLE_NYC_N + " as n"],
    column_names=[
        "CONCAT(CHAR32(pickup_longitude), CHAR32(pickup_latitude)) as pickup_name",
        "t.pickup_longitude",
        "t.pickup_latitude",
        "HASH(t.pickup_longitude + t.pickup_latitude) as pickup_id",
        "CONCAT(CHAR32(dropoff_longitude), CHAR32(dropoff_latitude)) as dropoff_name",
        "t.dropoff_longitude",
        "t.dropoff_latitude",
        "HASH(t.dropoff_longitude + t.dropoff_latitude) as dropoff_id",
        "t.total_amount"
    ],
    expressions=[
        "(STXY_CONTAINS(n.geom, t.pickup_longitude, t.pickup_latitude)) AND"
        "(STXY_CONTAINS(n.geom, t.dropoff_longitude, t.dropoff_latitude)) "
    ]
)["status_info"]["status"]
Before nyctaxi_graph_wkt can be created, the edges must be derived from
the taxi_tables_joined dataset's XY pickup and dropoff pairs to create the
nyctaxi_edges_weights_wkt dataset; note that REMOVE_NULLABLE is used to
remove a nullable column property, which would prevent the graph from being
created:
print(
    "Creating a projection from {} to contain the {} edges.".format(
        JOIN_TAXI, GRAPH_T
    )
)
edges_wkt_response = kinetica.create_projection(
    table_name=JOIN_TAXI,
    projection_name=TABLE_TAXI_EW,
    column_names=[
        "REMOVE_NULLABLE(ST_MAKELINE(ST_MAKEPOINT(pickup_longitude, pickup_latitude), ST_MAKEPOINT(dropoff_longitude, dropoff_latitude))) AS tripwkt",
        "total_amount"
    ],
    options={}
)["status_info"]["status"]
Now, nyctaxi_graph_wkt is created with the following characteristics:
- It is not directed because the trips aren't in a meaningful order
- It has no explicitly defined
nodesbecause the example relies on the implicit nodes attached to the defined edges - The
edgesin this graph are represented using the WKT LINESTRINGs in thetripwktcolumn of thenyctaxi_edges_weights_wkttable (EDGE_WKTLINE). - The
weightsin this graph are represented using the dollar amounts found in thetotal_amountcolumn of thenyctaxi_edges_weights_wkttable (WEIGHTS_VALUESPECIFIED). The weights are matched to the edges using the sametripwktcolumn as the edges (WEIGHTS_EDGE_WKTLINE). - It has no inherent
restrictionsfor any of the nodes or edges in the graph - It will be replaced with this instance of the graph if a graph of the same
name exists (
recreate). - If nodes are within 0.01 degrees of each other, they will be merged together
(
merge_tolerance)
print("Creating {}".format(GRAPH_T))
create_t_graph_response = kinetica.create_graph(
    graph_name=GRAPH_T,
    directed_graph=False,
    nodes=[],
    edges=[
        TABLE_TAXI_EW + ".tripwkt AS EDGE_WKTLINE"
    ],
    weights=[
        TABLE_TAXI_EW + ".tripwkt AS WEIGHTS_EDGE_WKTLINE",
        TABLE_TAXI_EW + ".total_amount AS WEIGHTS_VALUESPECIFIED"
    ],
    restrictions=[],
    options={
        "recreate": "true",
        "merge_tolerance": "0.01"
    }
)
Multiple Routing
Before the nyctaxi_graph_wkt graph is solved, the source node and
destination nodes are defined.
source_node = "POINT(-73.98438262939453 40.76493835449219)"  # node 2
destination_nodes = [
    "POINT(-73.97122955322266 40.74700927734375)",  # node 39
    "POINT(-73.97740173339844 40.77263641357422)"  # node 85
]
Next, the graph is solved with the solve results being exported to the response:
solve_t1_mrgraph_response = kinetica.solve_graph(
    graph_name=GRAPH_T,
    solver_type="MULTIPLE_ROUTING",
    source_nodes=[source_node],
    destination_nodes=destination_nodes,
    solution_table=GRAPH_T_MRSOLVED,
    options={"export_solve_results": "true"}
)["result_per_destination_node"][0]
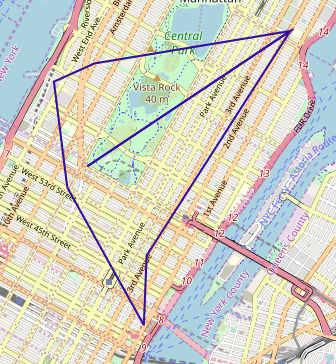
The cost for the source node to visit the destination nodes is represented as total amount in dollars:
Cost for source node POINT(-73.98438262939453 40.76493835449219) to visit destination nodes ['POINT(-73.97122955322266 40.74700927734375)', 'POINT(-73.97740173339844 40.77263641357422)']: $218.46
The solution output to WMS:
Download & Run
Included below is a complete example containing all the above requests, the data files, and output.
To run the complete sample, ensure the
solve_graph_nyctaxi_multi_route.py and nyc_neighborhood.csv
files are in the same directory (assuming the locations were not changed in the
solve_graph_nyctaxi_multi_route.py script) and the nyctaxi dataset
has been ingested; then switch to that directory and do the following:
If on the Kinetica host:
/opt/gpudb/bin/gpudb_python solve_graph_nyctaxi_multi_route.py
If running after using PyPI or GitHub to install the Python API:
python solve_graph_nyctaxi_multi_route.py