Note
This documentation is for a prior release of Kinetica. For the latest documentation, click here.
The Cluster menu selection comprises several tabs that contain information about all the machines in your cluster as well as configuration and log file access. Summary data about your Kinetica cluster is pinned to the top right of each tab within Cluster; it includes:
- The status of Kinetica
- How many users are connected to Kinetica
- How many requests per second are being made to Kinetica
- How many tables are present in this Kinetica cluster
- How many rows are present in this Kinetica cluster
- The uptime of this Kinetica cluster
- A refresh button to refresh the cluster information

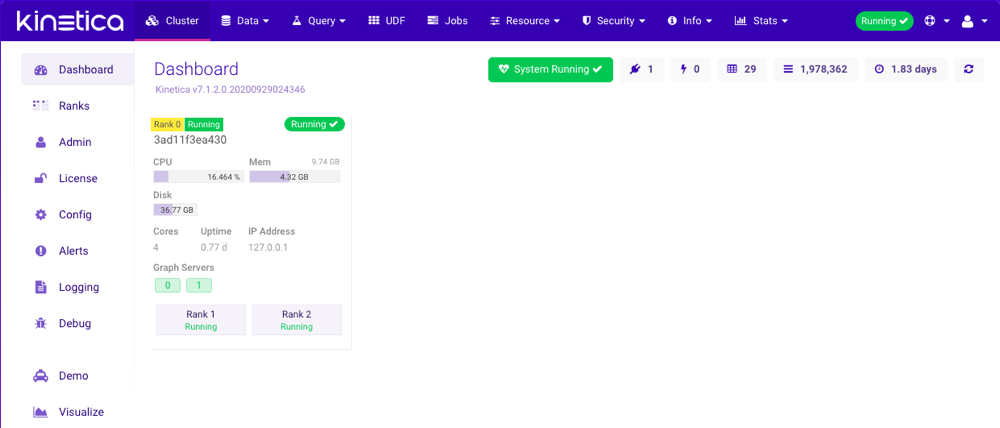
Dashboard
The Dashboard page is also the GAdmin homepage. It highlights the most important information about all the machines in your cluster, including CPU, Memory, and Disk usage.
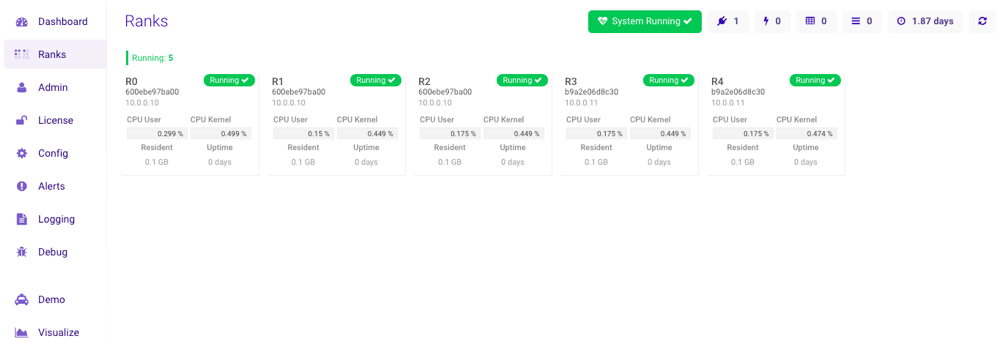
Ranks
The Ranks page displays important information about all the GPU ranks being used in your cluster.
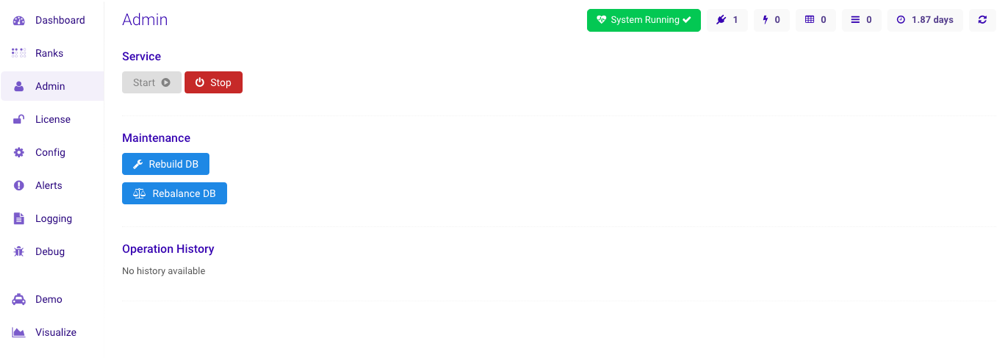
Admin
Important
The section is only available to users with the System Admin permission.
The Admin page allows you to stop or start the database, rebuild the database, rebalance the database, or review operation history (add, remove, or rebalance node operations) information.
Click Rebuild DB to rebuild the database should you experience database errors or some tables and/or schemas are unable to be queried. All tables can be rebuilt or just tables with disk optimized columns and/or tables with text search columns can be rebuilt. For more information on rebuilding individual tables or schemas, see Rebuilding.
Click Rebalance DB to optionally shuffle around sharded and unsharded data across your cluster so all nodes could have roughly the same amount of sharded and unsharded data. If choosing to rebalance unsharded data, optionally provide a whitelist or blacklist of unsharded tables' names.
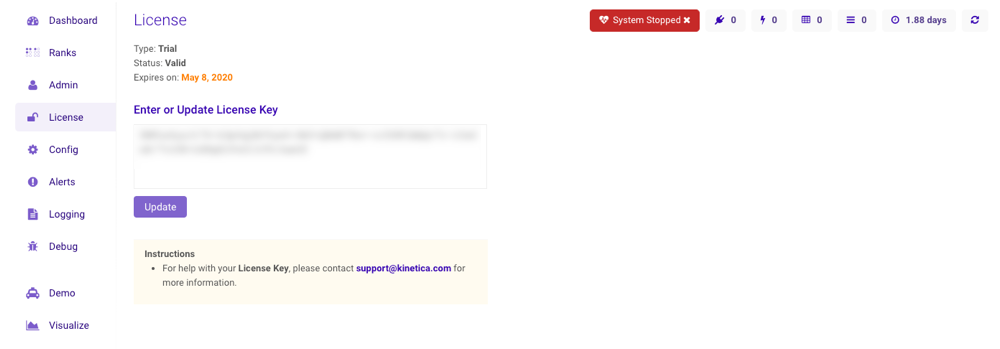
License
Important
The section is only available to users with the System Admin permission.
The License page provides management capability for the Kinetica license used by the cluster. The page will list the type, status, and expiration date of the active license.
Note
The license can only be modified when Kinetica is not running.
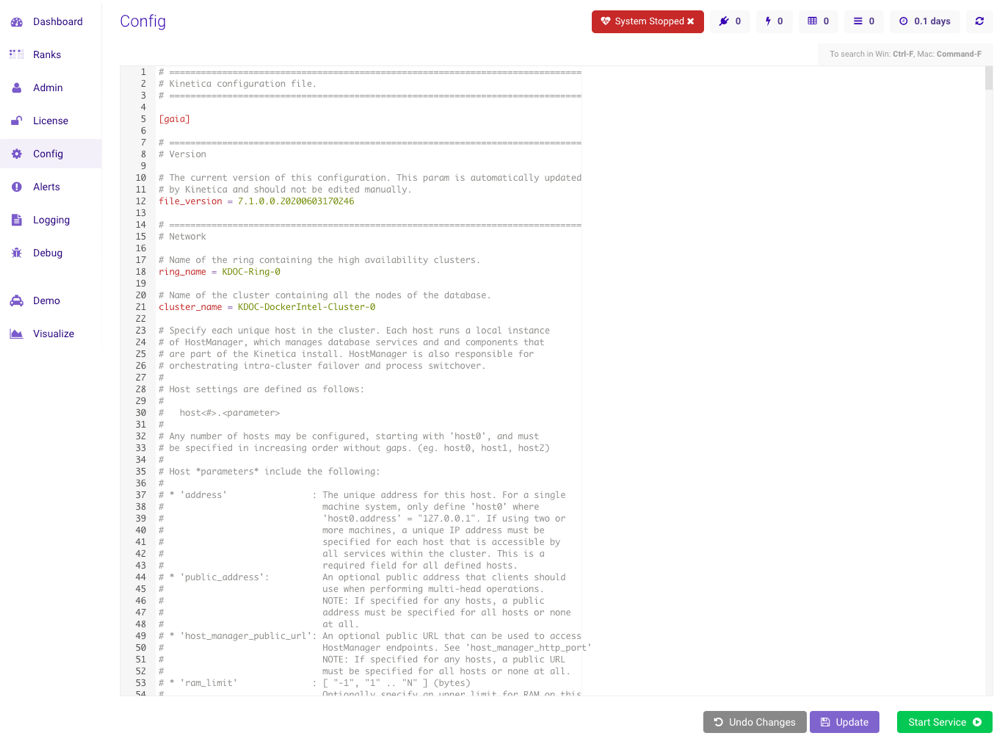
Config
Important
The section is only available to users with the System Admin permission.
The Config page allows you to edit the core Kinetica configuration
file and save the changes directly in GAdmin; this file maps
to the /opt/gpudb/core/etc/gpudb.conf file. Detailed
information about configuration file settings can be found on
Configuration Reference.
Note
This tab can only be edited when Kinetica is not running.
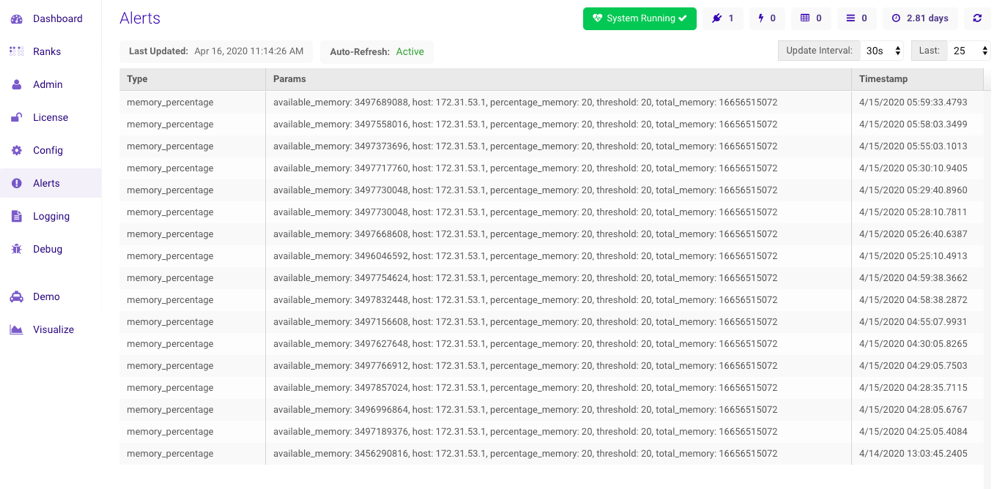
Alerts
The Alerts displays the most recent triggered alerts. Detailed information about alerts and how to set them can be found on Alerting.
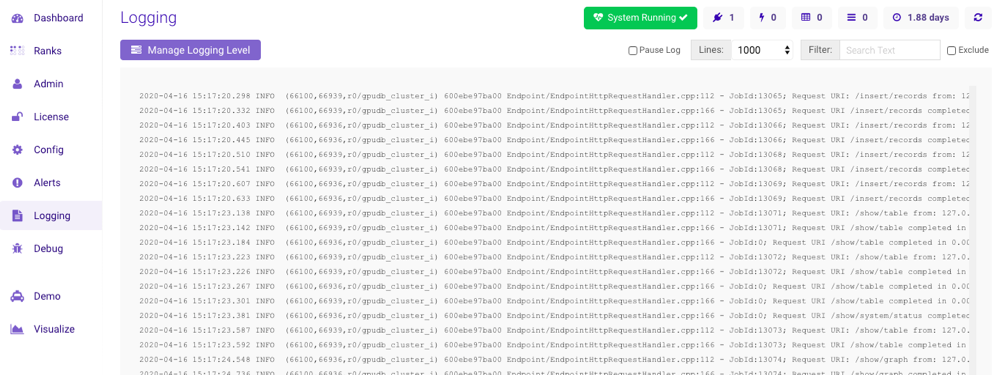
Logging
The Logging page displays the running system log file, updating
every two seconds. This file is Kinetica's main diagnostic tool and it is
located at
/opt/gpudb/core/logs/host-manager-<hostname>-<date-time>.log.
Note
If the cluster uses a shared persist directory, each nodes' database log will be located in this directory as well.
Select the Pause Log checkbox to pause the file updates. The number of displayed lines can be selected from Lines, and the displayed lines can be filtered using Filter (select the Exclude checkbox to instead exclude the filtered word or phrase).
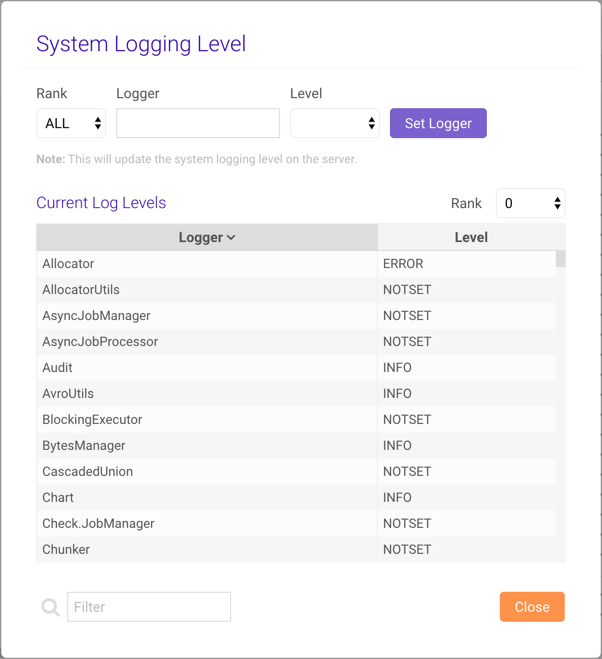
Setting Loggers
Click Manage Logging Level to open the Manage System Logging Level window, where the per-rank logging level for any system logger can be modified.
To view the active loggers and corresponding levels for each rank, select the rank from the Rank drop-down menu above the Current Log Levels list. Use the Filter below the list to find a particular logger in the list.
To update a logger:
- At the top of the window, select a rank or ALL from the Rank drop-down window.
- Provide a logger name for the Logger field.
- Select a logger level from the Level drop-down menu.
- Click Set Logger.
Tip
Instructions for manually changing the logging level via the /opt/gpudb/core/etc/gpudb_logger.conf file are located on the Custom Logging documentation.
Any change will take effect immediately and be in effect until a subsequent change is made to the same logger or the database is restarted. A database restart will reset all loggers to their default levels, system-wide.
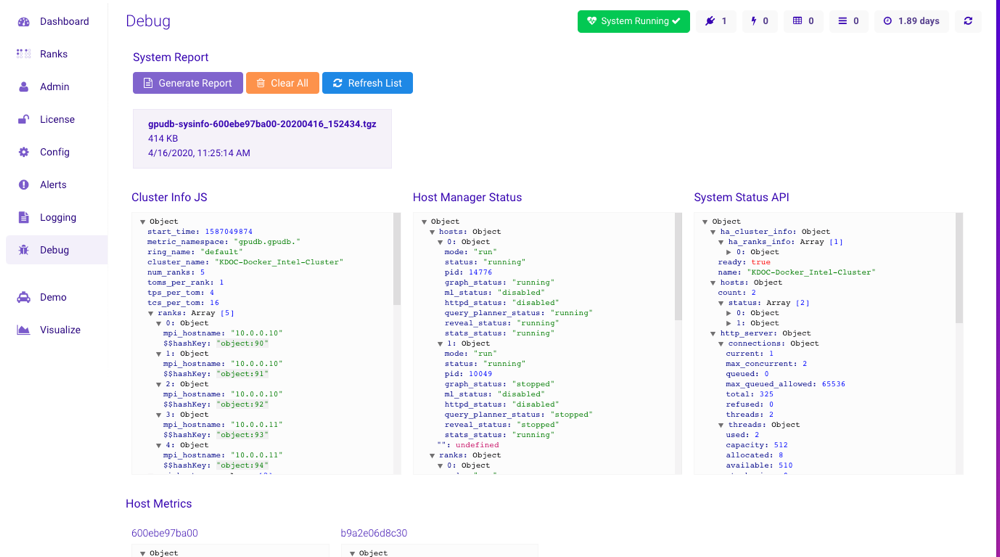
Debug
The Debug page displays debugging and metric information about your cluster. Note that each section has nested information, so it's possible to drill in for more details. From this page, you can also generate system reports and access previous reports. A system report includes important logs and files that can be sent to support (support@kinetica.com) to help diagnose any issues at hand.
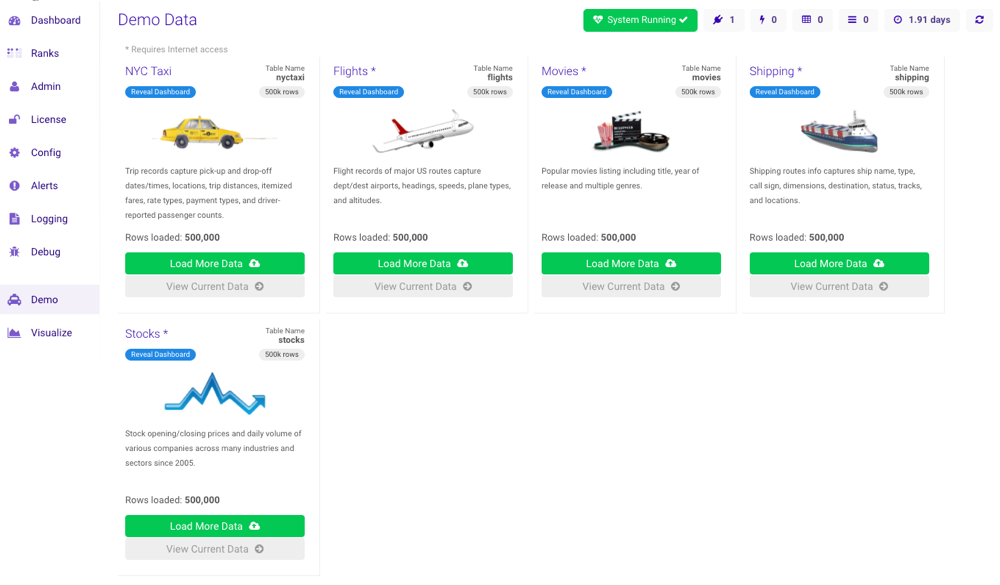
Demo
Important
The section is only available to users with the System Admin permission.
The Demo page contains various data that you can load into Kinetica. This data will help get you started using Kinetica as well as demonstrate some key capabilities of the system. Each demo dataset contains 500,000 records; after loading the data into Kinetica, you have the option of loading the same data again. The datasets with a Reveal Dashboard button have a corresponding Reveal dashboard that will be automatically setup in Reveal after ingesting the data.