Network Graphs & Solvers REST Tutorial (DC)
The following guide provides step-by-step instructions to get started with using the Network Graphs & Solvers in Kinetica. This guide demonstrates some key graph concepts as well as how to create and solve a graph using the Kinetica REST API.
Prerequisites
D.C. Shape data file- Access to GAdmin
- Access to a REST client or a terminal
Data File
The tutorial makes use of the dc_shape dataset, which can be ingested from
the data file mentioned above.
To ingest the file using GAdmin:
- Navigate to GAdmin and login (
http://<kinetica-host>:8080/) - In the top menu, click
- In the top right corner, click Advanced CSV Import
- Click Select File and select the data file from your local directory
- Leave the default options and values for the rest of Step 1 and Step 2
- Under Step 3: Confirm, click Import CSV
The file will be validated and records will be inserted.
Using the REST API
As mentioned above, running the following examples requires access to a REST client or a terminal. GAdmin contains a REST client () into which you can copy and paste JSON, so there's no need to download a third-party REST client. If opting to run the tutorial via a terminal, the tutorial script and cURL package are required. See Tutorial via Terminal for more information.
Key Information and Concepts
After the data file has been ingested into Kinetica, you should learn about the dataset and how it relates to the Network Graphs Solvers.
Data
The dc_shape dataset is a HERE dataset and is analogous to most road network
datasets you could find in that it includes columns for the type of road, the
average speed, the direction of the road, a WKT linestring for its geographic
location, a unique ID integer for the road, and more. The graph used in the
example is created with two columns from the dc_shape dataset:
shape-- a WKT linestring composed of points that make up various streets, roads, highways, alleyways, and footpaths throughout Washington, D.C.direction-- an integer column that conveys information about the directionality of the road, with forward meaning the direction in which the way is drawn in OSM and backward being the opposite direction:0-- a forward one-way road1-- a two-way road2-- a backward one-way road
You'll notice later that the shape column is also part of an inline
calculation for distance as weight during graph creation using
the ST_LENGTH and ST_NPOINTS
geospatial functions.
Graph Concepts
A graph typically comprises Nodes, Edges, Weights, Restrictions but only requires edges and weights. The graph created in this tutorial only uses edges and weights.
In this particular example, edges are logically mapped to sections of roadways and footpaths throughout the Washington, D.C., area. Each edge corresponds to a consecutive pair of points from each of the source LINESTRINGs, so a LINESTRING containing n points will have n-1 edges. Because the source graph is not created with nodes, implicit nodes are assigned at either end of each edge after graph creation.
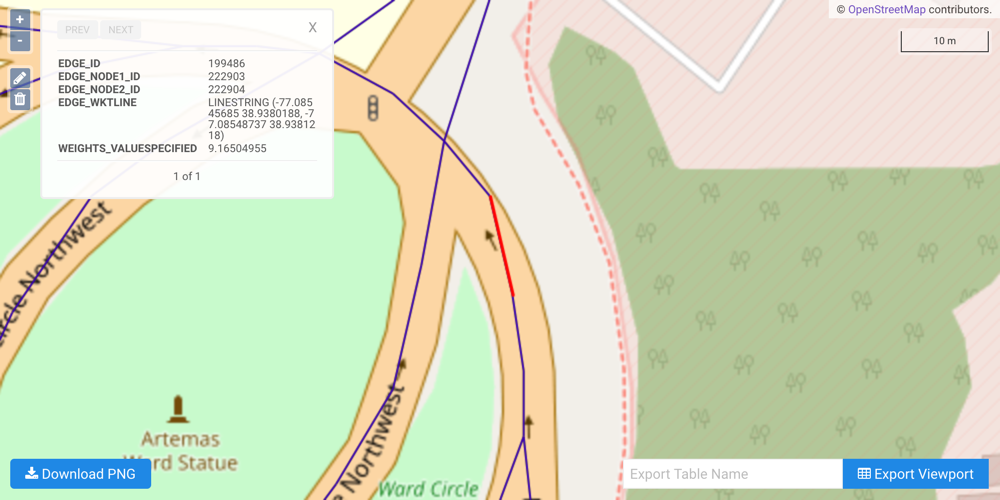
For example, link ID 18350083 is a part of the Ward Circle roundabout, which
itself is part of Massachusetts Avenue Northwest near American University.
Selecting link ID 18350083 from the dc_shape table reveals the following WKT
linestring (the end of the linestring was removed for clarity):
LINESTRING (-77.08544159 38.93787003, -77.08544159 38.93793869, -77.08545685 38.9380188, -77.08548737 38.9381218, ...)
As noted above, each consecutive pair of coordinates will correspond to an edge in the graph, e.g.:
- Edge A -
LINESTRING(-77.08544159 38.93787003, -77.08544159 38.93793869) - Edge B -
LINESTRING(-77.08544159 38.93793869, -77.08545685 38.9380188) - Edge C -
LINESTRING(-77.08545685 38.9380188, -77.08548737 38.9381218)
Tip
After graph creation (and assuming the graph table was created), you can view each edge's details, including its respective WKT linestring, using WMS and clicking an edge:
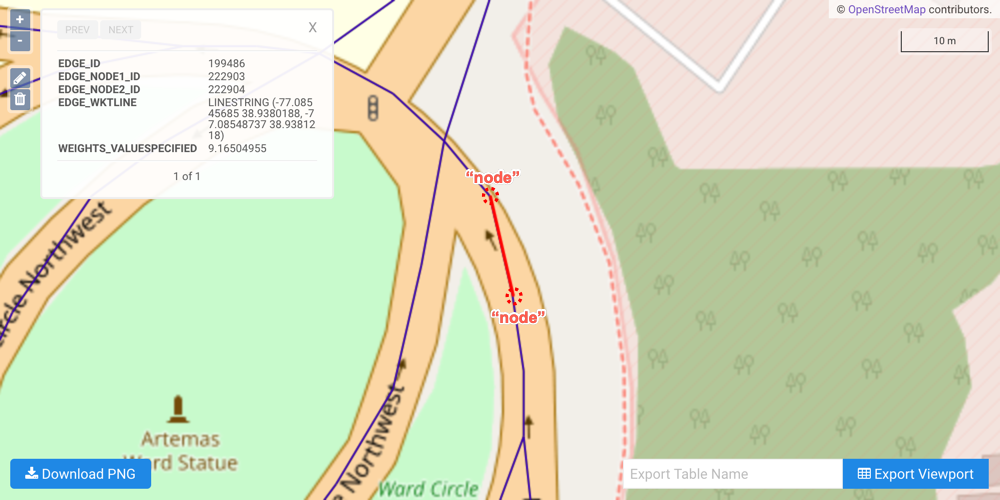
Each coordinate pair composing an edge is an implicit node:
Weights in this graph, as mentioned previously, are an abstract cost (distance, time, etc.) for travelling any roadway or footpath in the Washington, D.C., area. Weights are particularly important when solving a graph. There are two solver types presented in the tutorial below:
shortest_path-- Find the shortest path between two points on a graphmultiple_routing-- Find the quickest route between a source point and many destination points; also known as travelling salesman
Because there are no explicit nodes in the tutorial graph, source and destination point(s) must be selected from any of the edges comprising the Washington, D.C., road network. Otherwise, the graph will not be able to traverse to the point and will result in a null solution.
Tutorial via REST Client
This tutorial can be run via the GAdmin API Tool to create and solve the graph, but any REST client will work. To access the API tool in GAdmin:
- Navigate to GAdmin and login (
http://<kinetica-host>:8080/) - In the top menu, click
- Under Request Mode, select JSON
Create Graph
One graph is used for both solve graph examples later in the tutorial:
dc_shape_graph, a graph based on the aforementioned dc_shape dataset.
The dc_shape_graph graph is created with the following characteristics:
- It is directed because the roads in the graph have directionality (one-way and two-way roads)
- It has no explicitly defined
nodesbecause the example relies on implicit nodes attached to the defined edges - The
edgesare derived from WKT LINESTRINGs in theshapecolumn of thedc_shapetable (EDGE_WKTLINE). Each road segment's directionality is derived from thedirectioncolumn of thedc_shapetable (EDGE_DIRECTION). - The
weightsare represented as distance, which is calculated as the length of the entireshapecolumn's LINESTRING (in meters) divided by the number of points in the LINESTRING minus 1 (WEIGHTS_VALUESPECIFIED). The weights are matched to the edges using the sameshapecolumn as edges (WEIGHTS_EDGE_WKTLINE) and the samedirectioncolumn as the edge direction (WEIGHTS_EDGE_DIRECTION). - It has no inherent
restrictionsfor any of the nodes or edges in the graph - It utilizes the following options:
- It will be replaced with this instance of the graph if a graph of the same
name exists (
recreate) - If nodes are within 0.00001 degrees (1 meter) of each other, they will be
merged together (
merge_tolerance) - The resulting graph's information will be placed into a table
(
graph_table) and anEDGE_WKTLINEcolumn will be included so the graph can be visualized (enable_graph_draw)
- It will be replaced with this instance of the graph if a graph of the same
name exists (
To create the graph:
In the API Tool, select /create/graph from the Endpoint drop-down menu
Copy the following JSON into the Request Mode text box:
{
  "graph_name": "dc_shape_graph",
  "directed_graph": true,
  "nodes": [],
  "edges": [
    "dc_shape.shape AS EDGE_WKTLINE",
    "dc_shape.direction AS EDGE_DIRECTION"
  ],
  "weights": [
    "dc_shape.shape AS WEIGHTS_EDGE_WKTLINE",
    "dc_shape.direction AS WEIGHTS_EDGE_DIRECTION",
    "ST_Length(dc_shape.shape,1)/(ST_NPOINTS(dc_shape.shape)-1) AS WEIGHTS_VALUESPECIFIED"
  ],
  "restrictions": [],
  "options": {
    "merge_tolerance": "0.00001",
    "recreate": "true",
    "enable_graph_draw": "true",
    "graph_table": "dc_shape_graph_table"
  }
}
Click Send Request
The response field on the right-hand side of the page will be populated with the server response:
------------------------------------------------------------
Thu Jan 16 2020 10:52:34 GMT-0500 (Eastern Standard Time)
------------------------------------------------------------
Endpoint: /create/graph
Time: 24549
Request: {
    "graph_name": "dc_shape_graph",
    "directed_graph": true,
    "nodes": [],
    "edges": [
        "dc_shape.shape AS EDGE_WKTLINE",
        "dc_shape.direction AS EDGE_DIRECTION"
    ],
    "weights": [
        "dc_shape.shape AS WEIGHTS_EDGE_WKTLINE",
        "dc_shape.direction AS WEIGHTS_EDGE_DIRECTION",
        "ST_Length(dc_shape.shape,1)/(ST_NPOINTS(dc_shape.shape)-1) AS WEIGHTS_VALUESPECIFIED"
    ],
    "restrictions": [],
    "options": {
        "merge_tolerance": "0.00001",
        "recreate": "true",
        "enable_graph_draw": "true",
        "graph_table": "dc_shape_graph_table"
    }
}
Response: {
    "num_nodes": 446491,
    "num_edges": 491461,
    "edges_ids": [],
    "info": {
        "status": "OK"
    }
}
Solve the Graph (Shortest Path)
The following scenario has been designed to illustrate a shortest path solution:
You work near the White House, and after you get off work, you'd like to attend a baseball game at the nearby ballpark. What's the shortest path you could take to get to the ballpark?
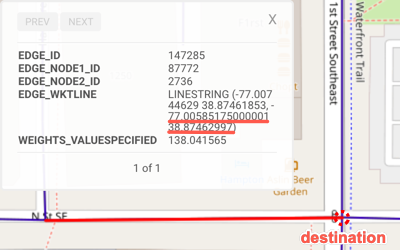
Important
The source and destination points were selected from endpoints of
edges within the graph. The easiest way to review
the points that make up an edge is using the
WMS tool on the graph table
(dc_shape_graph_table).
| Source / Destination | Source | Destination |
| WKT | POINT(-77.03511810000001 38.89876175) |
POINT(-77.00585175000001 38.87462997) |
| Location Description | The corner of Madison Place Northwest and Pennsylvania Avenue Northwest | The corner of N Street Southeast and Southeast 1st street |
| WMS Location | 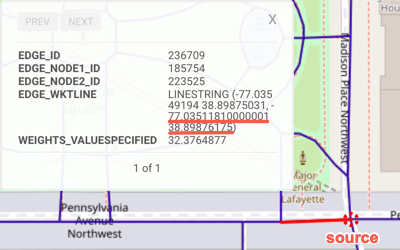
|
|
To generate the solution:
In the API Tool, select /solve/graph from the Endpoint drop-down menu
Copy the following JSON into the Request Mode text box:
{
  "graph_name": "dc_shape_graph",
  "weights_on_edges": [],
  "restrictions": [],
  "solver_type": "shortest_path",
  "source_nodes": ["POINT(-77.03511810000001 38.89876175)"],
  "destination_nodes": ["POINT(-77.00585175000001 38.87462997)"],
  "solution_table": "dc_shape_graph_solved_shortest_path",
  "options": {}
}
Note
Because the tutorial graph was created using WKT linestrings, the
/solve/graphcall provides the source and destination points as WKT points.Click Send Request
The response field on the right-hand side of the page will be populated with the server response:
------------------------------------------------------------
Thu Jan 16 2020 11:40:33 GMT-0500 (Eastern Standard Time)
------------------------------------------------------------
Endpoint: /solve/graph
Time: 347
Request: {
    "graph_name": "dc_shape_graph",
    "weights_on_edges": [],
    "restrictions": [],
    "solver_type": "shortest_path",
    "source_nodes": [
        "POINT(-77.03511810000001 38.89876175)"
    ],
    "destination_nodes": [
        "POINT(-77.00585175000001 38.87462997)"
    ],
    "solution_table": "dc_shape_graph_solved_shortest_path",
    "options": {}
}
Response: {
    "result": true,
    "result_per_destination_node": [],
    "info": {
        "status": "OK"
    }
}
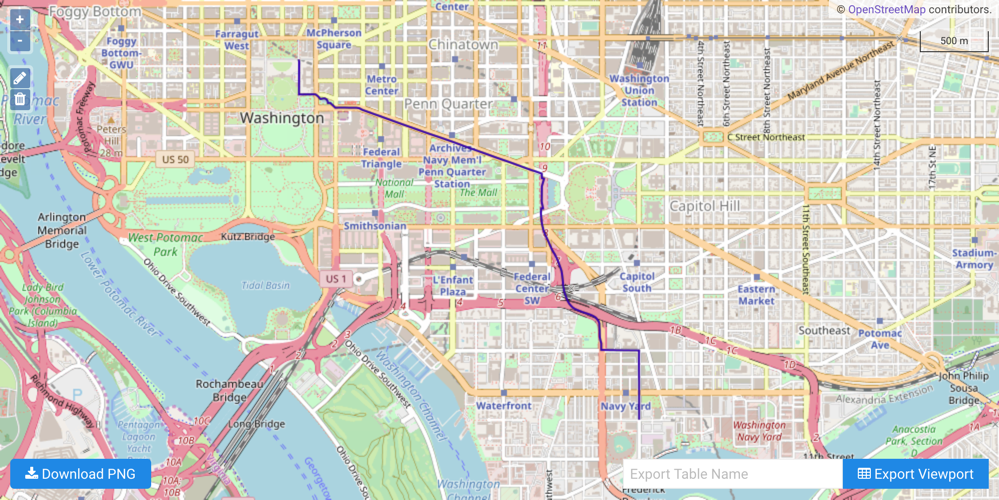
The solution output to WMS:
Solve the Graph (Multiple Routing)
The following scenario has been designed to illustrate a multiple routing solution:
You're currently taking the subway to Union Station to visit Washington D.C. for the day. You would like to see some of the most iconic monuments and buildings in Washington, D.C. before returning back to Union Station. Starting from Union Station, what's the quickest route between each stop before returning back to Union Station?
Important
The source and destination points were selected from endpoints of
edges within the graph. The easiest way to review
the points that make up an edge is using the
WMS tool on the graph table
(dc_shape_graph_table).
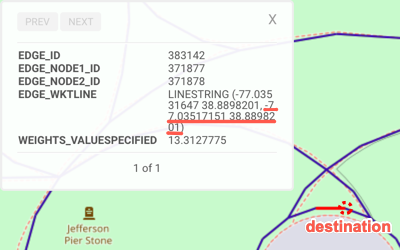
| Source / Destination | Source | Destination | Destination | Destination | Destination |
| WKT | POINT(-77.00576019 38.89677811) |
POINT(-77.03517151 38.8898201) |
POINT(-77.03626251 38.88068008) |
POINT(-77.04974365 38.89020157) |
POINT(-77.01207733 38.89072037) |
| Location Description | Union Station | Near the Washington Monument | Near the Jefferson Memorial | Near the Lincoln Memorial | Near Capitol Hill |
| WMS Location | 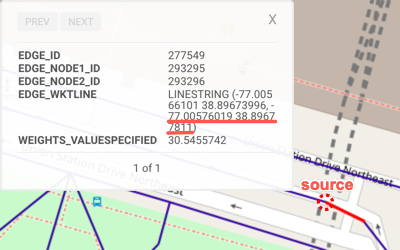
|
|
|
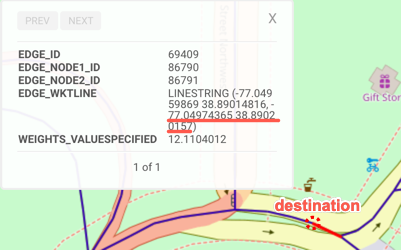
|
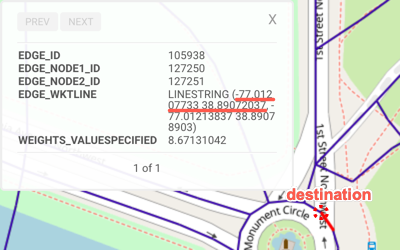
|
To generate the solution:
In the API Tool, select /solve/graph from the Endpoint drop-down menu
Copy the following JSON into the Request Mode text box:
{
  "graph_name": "dc_shape_graph",
  "weights_on_edges": [],
  "restrictions": [],
  "solver_type": "multiple_routing",
  "source_nodes": ["POINT(-77.00576019 38.89677811)"],
  "destination_nodes": [
    "POINT(-77.03517151 38.8898201)",
    "POINT(-77.03626251 38.88068008)",
    "POINT(-77.04974365 38.89020157)",
    "POINT(-77.01207733 38.89072037)"
  ],
  "solution_table": "dc_shape_graph_solved_multiple_routing",
  "options": {}
}
Note
Because the tutorial graph was created using WKT linestrings, the
/solve/graphcall provides the source and destination points as WKT points.Click Send Request
The response field on the right-hand side of the page will be populated with the server response:
------------------------------------------------------------
Thu Jan 16 2020 12:48:18 GMT-0500 (Eastern Standard Time)
------------------------------------------------------------
Endpoint: /solve/graph
Time: 963
Request: {
    "graph_name": "dc_shape_graph",
    "weights_on_edges": [],
    "restrictions": [],
    "solver_type": "multiple_routing",
    "source_nodes": [
        "POINT(-77.00576019 38.89677811)"
    ],
    "destination_nodes": [
        "POINT(-77.03517151 38.8898201)",
        "POINT(-77.03626251 38.88068008)",
        "POINT(-77.04974365 38.89020157)",
        "POINT(-77.01207733 38.89072037)"
    ],
    "solution_table": "dc_shape_graph_solved_multiple_routing",
    "options": {}
}
Response: {
    "result": true,
    "result_per_destination_node": [],
    "info": {
        "status": "OK"
    }
}
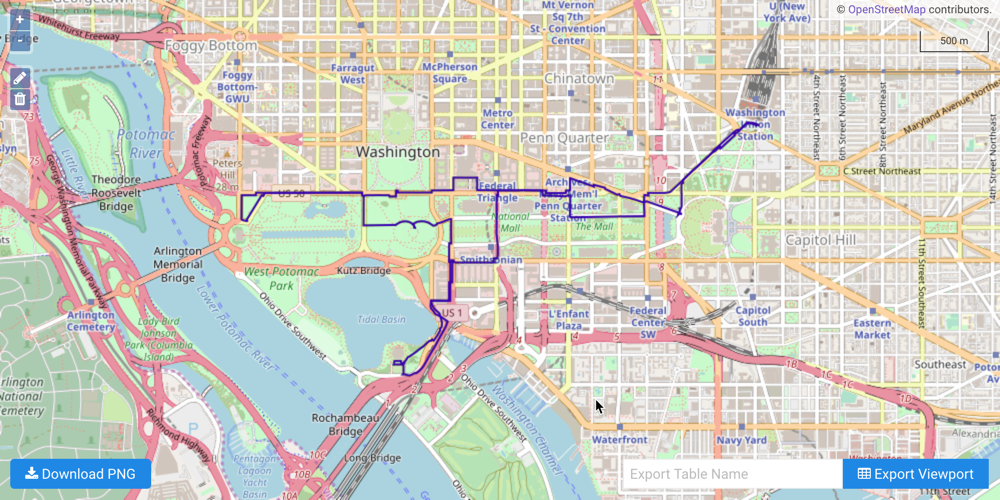
The solution output to WMS:
Tutorial via Terminal
Included below is the complete tutorial containing all the above requests and the necessary JSON files:
Graph tutorial script/create/graph JSON/solve/graph JSON (shortest path)/solve/graph JSON (multiple routing)
To run the complete sample, ensure the graphs_rest.sh and the JSON files
are in the same directory; then switch to that directory and do the following:
./graphs_rest.sh <kinetica-host>