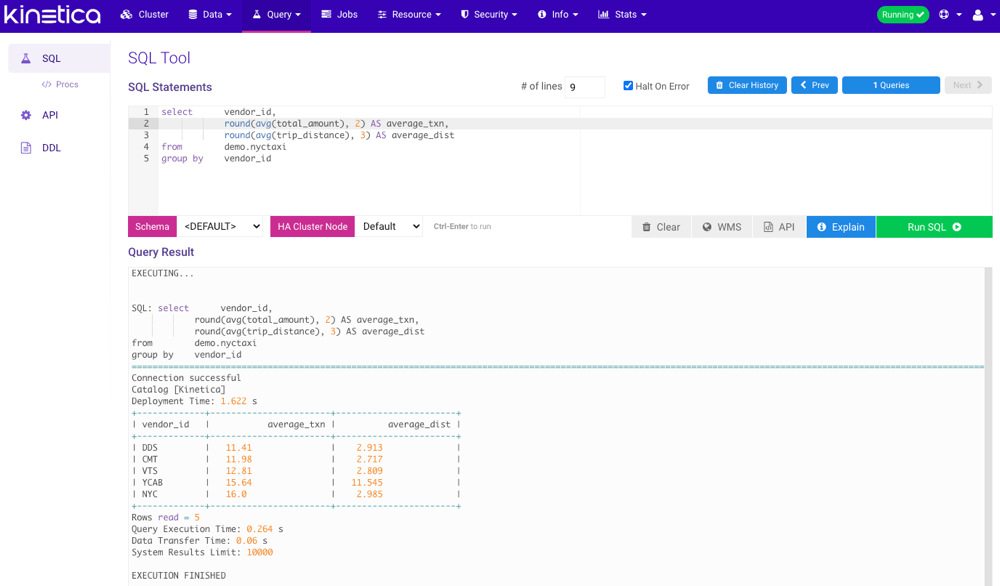
SQL Tool
The SQL Tool allows you to perform SQL queries against the data in Kinetica from GAdmin. The SQL Tool works similarly to the SQL Lab in Reveal but has fewer restrictions. To read more about using the SQL Tool from the command line (also known as KiSQL), review Kinetica SQL (KiSQL). Several actions are available from this tool:- Increase or decrease the # of lines to increase or decrease the size of the SQL Statements box.
- Select Halt on Error to halt SQL query execution if an error occurs. This is particularly useful when executing several statements in sequence as this will break on the first error in that sequence
- Click Clear History to remove all previously executed queries from the list.
- You can view and page through your query history using the < Prev and Next > buttons, or view & select (for re-execution) from the entire history using the Queries button in between them. Once the SQL Query History window is open, use the filter box to search the history for a particular value and click a query to re-load it.
- You can select a Schema to run queries in by default allowing you
to query without specifying a fully qualified table name, e.g.,
FROM schema.table_name. You can query outside of the set schema by providing a different schema in the SQL Statements area. - If HA is enabled, you can select a particular HA Cluster Node to run the provided query against.
- Click Clear to clear both the SQL Statements & Query Result areas.
- After entering a query into the SQL Statements area, click WMS to create a WMS call from the query, which will place the results in a temporary table and open the WMS window. Once done browsing, close the WMS window to delete the temporary table.
- After entering a query into the SQL Statements area, click API to generate the Python code necessary to run the same query via the native Python API.
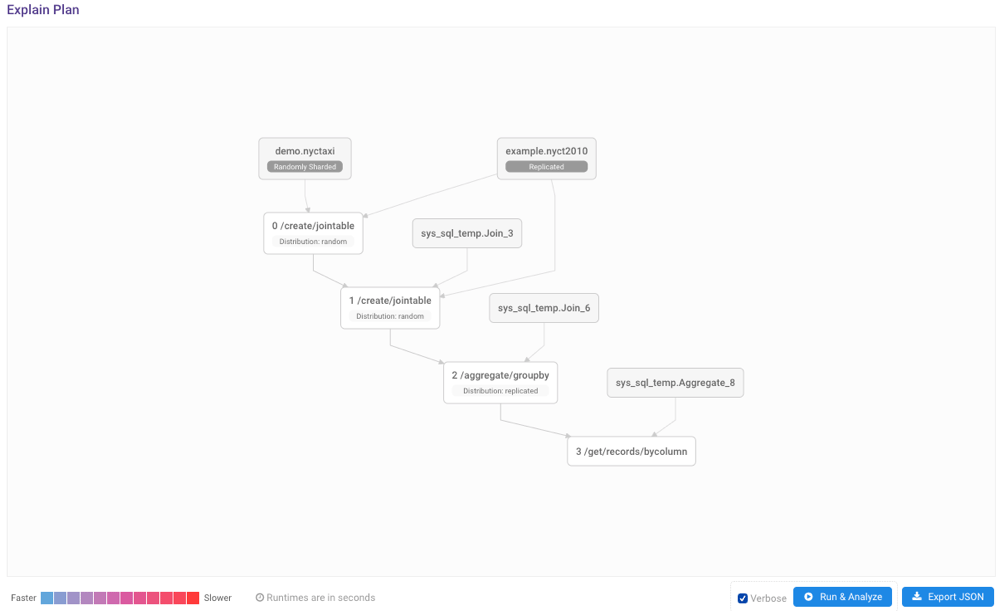
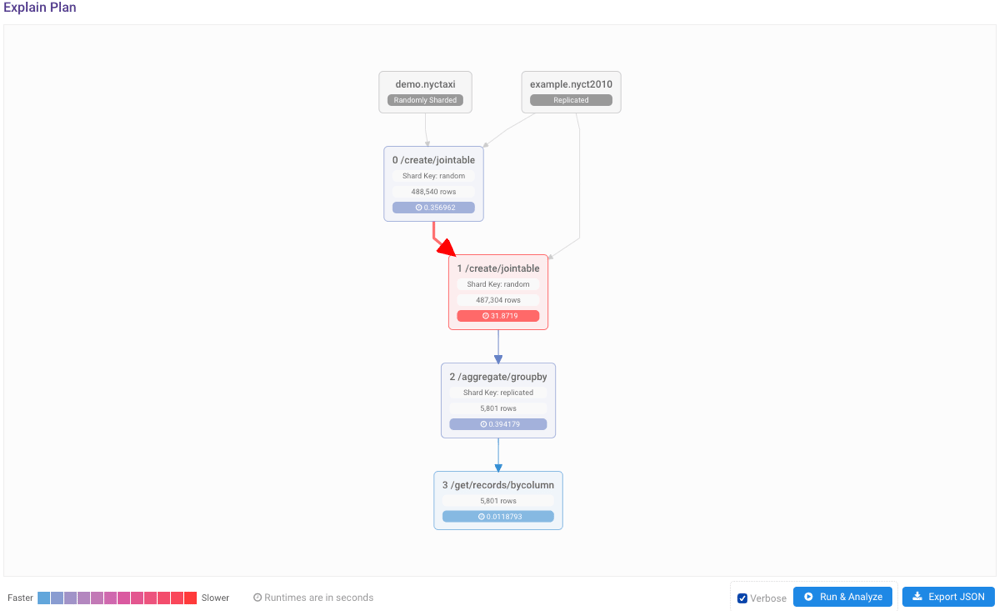
- After entering one or more semicolon-terminated queries and/or DML/DDL commands into the SQL Statements area, click Explain to output a visual execution plan of the provided query.
- Select a portion of the text entered into SQL Statements and click Run Highlighted to execute only the selected portion.
- After entering one or more semicolon-terminated queries and/or DML/DDL commands into the SQL Statements area, click Run SQL to execute.
The WMS and Explain functionality can act on everything in the
SQL Statements area or highlighted text, but they cannot
be executed if there are multiple statements in the text area with
nothing highlighted.
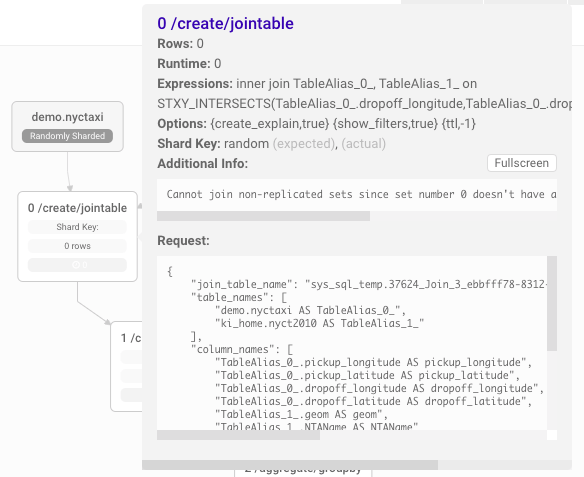
Explain
The explain plan visualizer is a graphical complement to using theEXPLAIN
keyword in a given query, providing visual detail to the
SQL query’s execution plan, execution time, and native API translation(s).
The explain plan visualizer cannot be used in conjunction with
the
EXPLAIN keyword.EXPLAIN keyword included) but this time
clicking Explain would yield the graphical query plan:
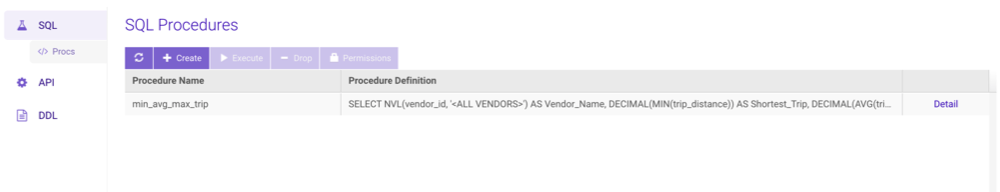
SQL Procedures
The SQL Procedures page displays all existing SQL procedures. Review SQL Procedures for more information on SQL procedures.- Click Create to create a SQL procedure.
- Click Execute to manually execute the selected procedure. Note that any returned rows will not be displayed. Execute the procedure manually via the SQL tool to view any output.
- Click Drop to remove the selected procedure.
- Click Permissions to adjust the execute permissions for the selected procedure.
- Click Detail to display the SQL procedure’s definition.
Create
The SQL procedure creation process is simplified when using the interface; all that’s required to get started is some SQL code.- From the SQL Procedures page, click Create.
- Provide a Name for the procedure.
-
Optionally, provide an Execution Interval. Units can be one of
the following:
SECOND[S]MINUTE[S]HOUR[S]DAY[S]
-
Optionally, provide a Start Timestamp. The provided value should
be in the following format:
- Provide one or more semi-colon-separated SQL statements in the Statements text field. Review the supported statements.
- Click Create.
Permissions
While all SQL procedures are able to be viewed by any user, they can only be executed by certain users. To adjust the execute permissions for a particular SQL procedure:- From the SQL Procedures page, select a SQL procedure and click Permissions.
-
Adjust the permissions as necessary:
-
Edit execute permissions for users:
- Add: Click a user in the Available list and
then click Grant >> to grant the user
sql_proc_executepermission on the selected SQL procedure. - Remove: Click a user in the SQL Proc-level Granted list and
then click << Revoke to revoke the user’s
sql_proc_executepermission on the selected procedure.
- Add: Click a user in the Available list and
then click Grant >> to grant the user
-
Edit execute permissions for roles:
- Add: Click a role in the Available list and
then click Grant >> to grant the role
sql_proc_executepermission on the selected SQL procedure. - Remove: Click a role in the SQL Proc-level Granted list and
then click << Revoke to revoke the role’s
sql_proc_executepermission on the selected procedure.
- Add: Click a role in the Available list and
then click Grant >> to grant the role
-
Edit execute permissions for users:
API Tool
The API Tool allows you to call any Kinetica REST endpoint with a given set of parameters. Request Mode allows the choice of two methods for passing parameters in endpoint calls:- Builder - assign values to named parameters individually
- JSON - pass the request as a single block of JSON text
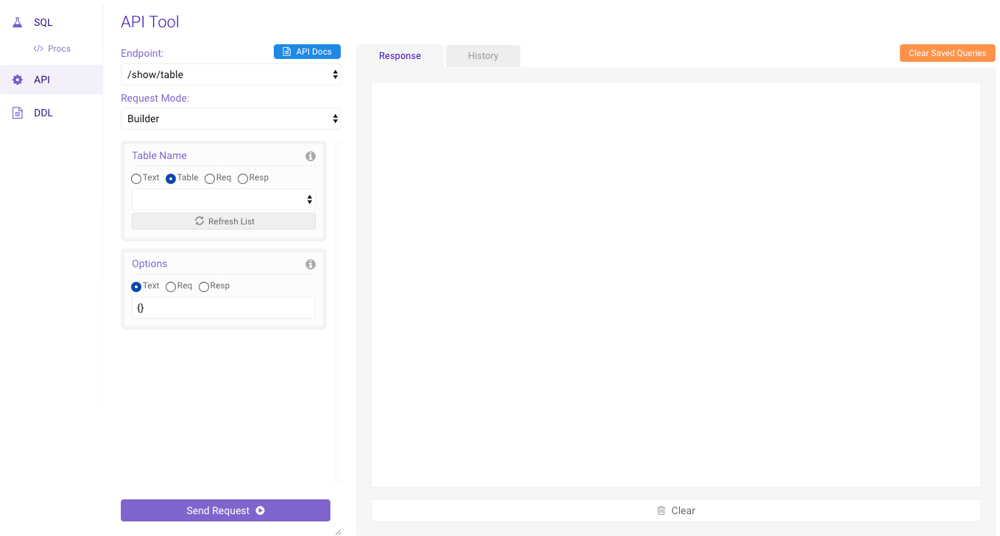
Builder
The Builder mode of the API Tool displays a user entry control for each of the selected endpoint’s parameters. Each control will show the parameter name & type and the option to enter the parameter as Text or to use a parameter from the previous request’s Response or Request object. The last set of parameters used in an endpoint call will be saved until the next time the endpoint is queried. Each request will log the request parameters in JSON format at the top of the Logs panel to the right. This request block can then be fed back into the API Tool in JSON mode, which may facilitate repeated querying, as the entire request can be seen and modified at one time. Here is an example of a request to the /aggregate/groupby endpoint in Builder mode: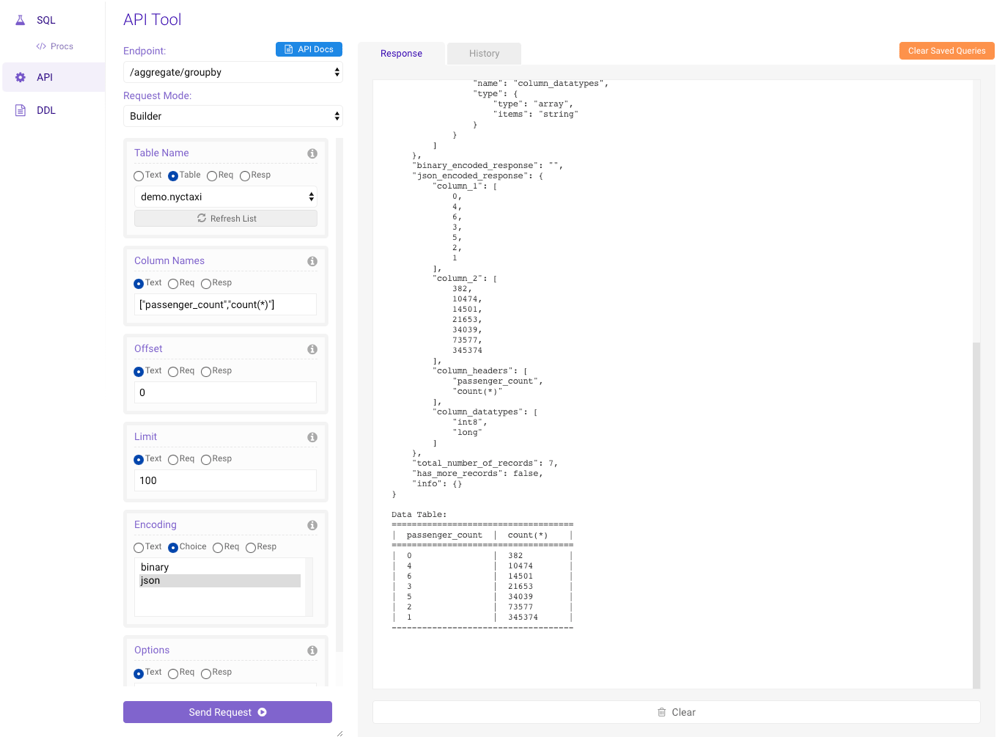
JSON
The JSON mode of the API Tool provides a user entry control to enter the request parameters as a single block of JSON. The last JSON request will be saved until the next time the endpoint is queried. Here is an example of a request to the /aggregate/groupby endpoint in JSON mode: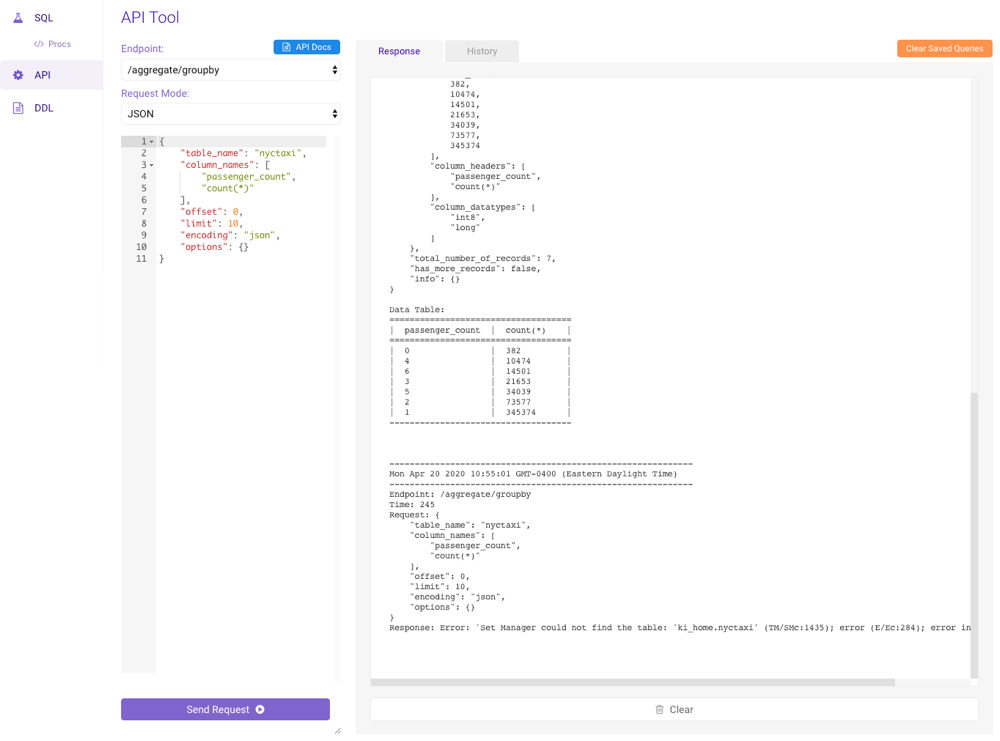
DDL Tool
The DDL Tool provides the ability to generate DDL for a given table, schema, or all database entities at once.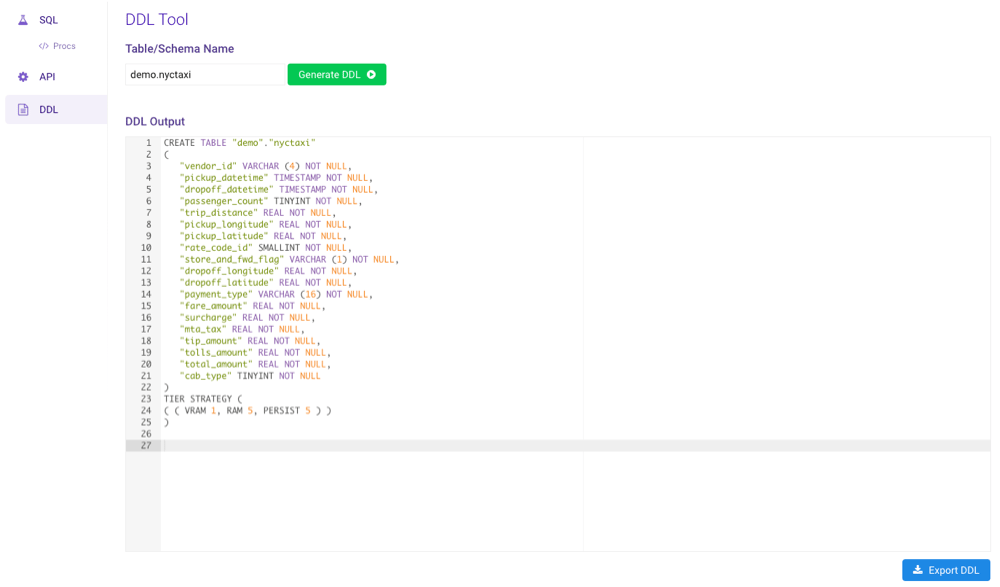
*, and click
Generate DDL to output the DDL to DDL Output. Click
Export DDL to save the generated DDL as a SQL script.
The output from this utility can be copied into the SQL Statements
area on the SQL Tool page and run in order to regenerate the
database entities whose DDL has been generated.