Graph Solvers with UI
End-to-End Graph Example Using the UI
Note
This documentation is for a prior release of Kinetica. For the latest documentation, click here.
End-to-End Graph Example Using the UI
The following guide provides step-by-step instructions to get started with using the Network Graphs & Solvers in Kinetica. This guide demonstrates some key graph concepts as well as how to create and solve a graph using the Workbench Data Explorer and Workbook.
The tutorial makes use of the dc_shape dataset, which can be ingested from the data file mentioned above.
To ingest the file using Workbench:
The file will be validated and records will be inserted.
After the data file has been ingested into Kinetica, you should learn about the dataset and how it relates to the Network Graphs Solvers.
The dc_shape dataset is a HERE dataset and is analogous to most road network datasets you could find in that it includes columns for the type of road, the average speed, the direction of the road, a WKT linestring for its geographic location, a unique ID integer for the road, and more. The graph used in the example is created with two columns from the dc_shape dataset:
You'll notice later that the shape column is also part of an inline calculation for distance as weight during graph creation using the ST_LENGTH and ST_NPOINTS geospatial functions.
A graph typically comprises nodes, edges, weights, and restrictions, but only requires edges and weights. The graph created in this tutorial only uses edges and weights.
In this particular example, edges are logically mapped to sections of roadways and footpaths throughout the Washington, D.C., area. Each edge corresponds to a consecutive pair of points from each of the source LINESTRINGs, so a LINESTRING containing n points will have n-1 edges. Because the source graph is not created with nodes, implicit nodes are assigned at either end of each edge after graph creation.
For example, link ID 18350083 is a part of the Ward Circle roundabout, which itself is part of Massachusetts Avenue Northwest near American University. Selecting link ID 18350083 from the dc_shape table reveals the following WKT linestring (the end of the linestring was removed for clarity):
LINESTRING (-77.08544159 38.93787003, -77.08544159 38.93793869, -77.08545685 38.9380188, -77.08548737 38.9381218, ...)
As noted above, each consecutive pair of coordinates will correspond to an edge in the graph, e.g.:
Weights in this graph, as mentioned previously, are an abstract cost (distance, time, etc.) for traveling any roadway or footpath in the Washington, D.C., area. Weights are particularly important when solving a graph. There are two solver types presented in the tutorial below:
Because there are no explicit nodes in the tutorial graph, source and destination point(s) must be selected from any of the edges comprising the Washington, D.C., road network. Otherwise, the graph will not be able to traverse to the point and will result in a null solution.
This tutorial is designed to be used with the Workbench Data Explorer and Workbook.
Before starting with graph creation, a schema, graph_gui, will be created to contain the tables supporting graph creation & solving. To create the schema:
One graph is used for both graph solving examples in the tutorial: dc_shape_graph, a graph based on the aforementioned dc_shape dataset. To create the graph:
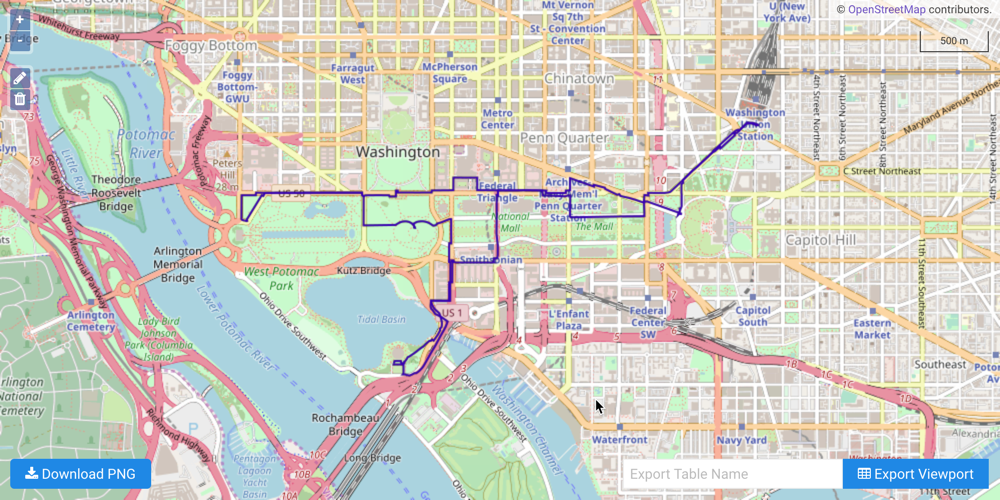
The following scenario has been designed to illustrate a shortest path solution:
You work near the White House, and after you get off work, you'd like to attend a baseball game at the nearby ballpark. What's the shortest path you could take to get to the ballpark?
Important
The source and destination points were selected from endpoints of edges within the graph.
| Source | Destination | |
|---|---|---|
| WKT | POINT(-77.03511810000001 38.89876175) | POINT(-77.00585175000001 38.87462997) |
| Location Description | The corner of Madison Place Northwest and Pennsylvania Avenue Northwest | The corner of N Street Southeast and Southeast 1st street |
| WMS Location | 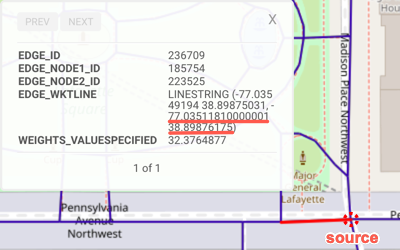 | 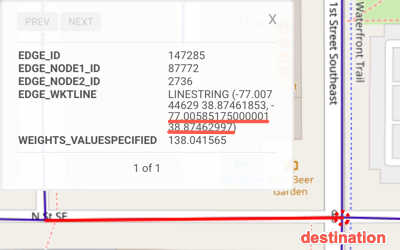 |
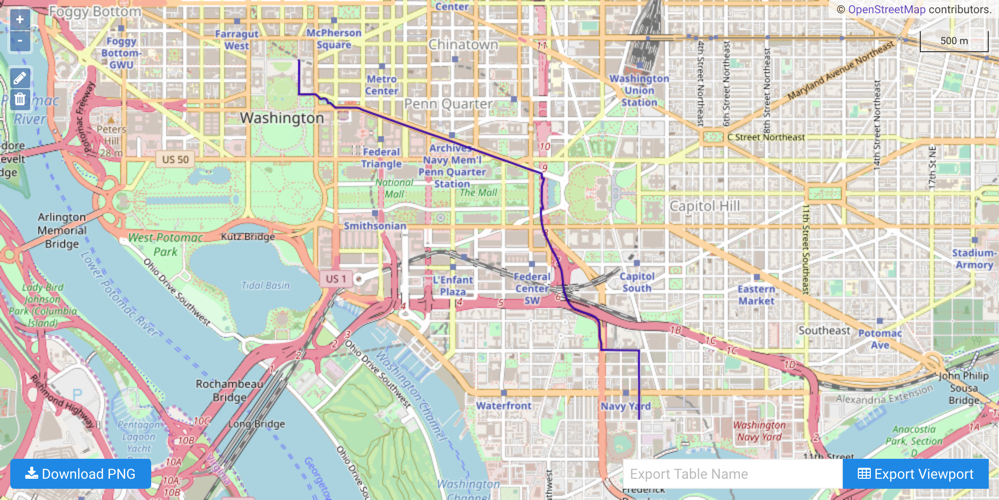
To solve the graph for shortest path:
| |
The following scenario has been designed to illustrate a multiple routing solution:
You're currently taking the subway to Union Station to visit Washington D.C. for the day. You would like to see some of the most iconic monuments and buildings in Washington, D.C. before returning back to Union Station. Starting from Union Station, what's the quickest route between each stop before returning back to Union Station?
Important
The source and destination points were selected from endpoints of edges within the graph.
| Source | Destination | Destination | Destination | Destination | |
|---|---|---|---|---|---|
| WKT | POINT(-77.00576019 38.89677811) | POINT(-77.03517151 38.8898201) | POINT(-77.03626251 38.88068008) | POINT(-77.04974365 38.89020157) | POINT(-77.01207733 38.89072037) |
| Location Description | Union Station | Near the Washington Monument | Near the Jefferson Memorial | Near the Lincoln Memorial | Near Capitol Hill |
| WMS Location | 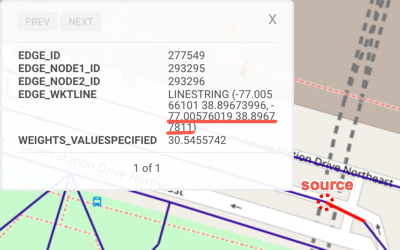 | 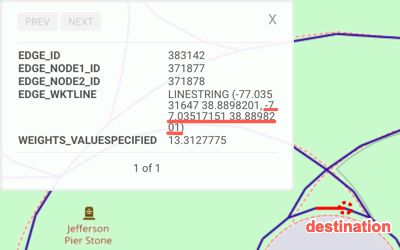 | 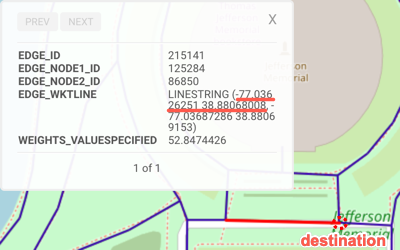 | 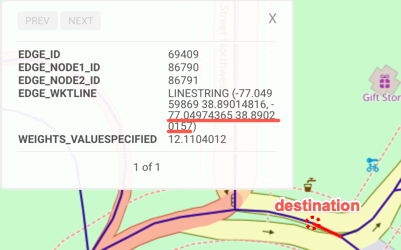 | 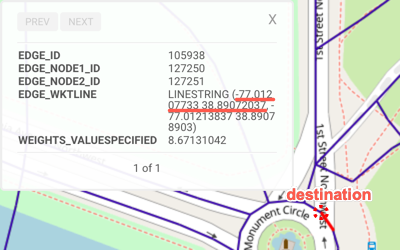 |
To solve the graph for shortest path:
In the same workbook as the previous example, add a new SQL block by clicking the SQL button near the top of the screen.
Copy the following into the new block:
| |
On the left hand menu under Data click on the newly created output table, dc_shape_graph_solved_multiple_routing, under the graph_gui schema.
Click WMS Preview, and make sure the WKT Column is set to wktroute under Configuration.
Keep everything else as is, and click Update.
A WMS window will open, display the solution: