Note
This documentation is for a prior release of Kinetica. For the latest documentation, click here.
Explorer Panel
On the left side of the screen, you will see a tabbed panel, which we call the Explorer. The Explorer has three main views: Data, Workbooks, & Files.
The Data Explorer UI displays all of the data you have in Kinetica, like tables, views, graphs, and data sources. The data objects are sorted by type, allowing you to minimize or expand each section, and filter through the object names using a text input.
The Workbook Explorer UI provides a means to organize a SQL-based set of commands or workflows for development or presentation purposes.
The File Explorer UI allows browsing of the Kinetica FileSystem (KiFS), where data files uploaded to Kinetica reside.
Data Explorer
When a data object is created using the UI-based wizard, it will appear in the Data Explorer automatically. When creating an object using a SQL Block, the Data Explorer will refresh automatically after the statement has been executed. Any queries executed in a worksheet that do not return rows will trigger a refresh of the Data Explorer to ensure you have the latest information about the system. The Data Explorer will show newly created objects, but if you do not see one listed, use the Refresh button at the top right of the Data Explorer to retrieve the latest information manually.
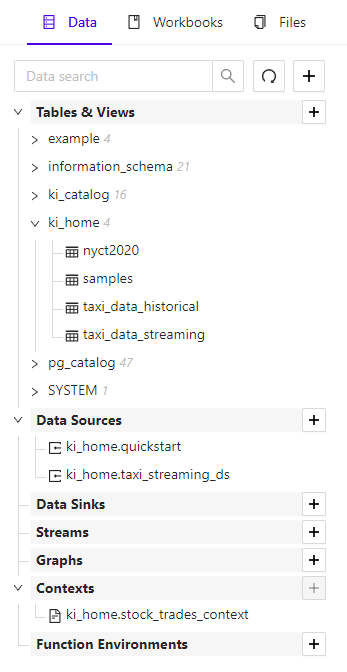
Data Explorer Tab
Creating and Modifying Data Objects
Create new data objects, like tables, data sources, or graphs, by clicking the plus + button at the top of the Data Explorer, or next to any of the data object type headings. You will be walked through options in a wizard. To modify an existing object, click the object and select Configure.
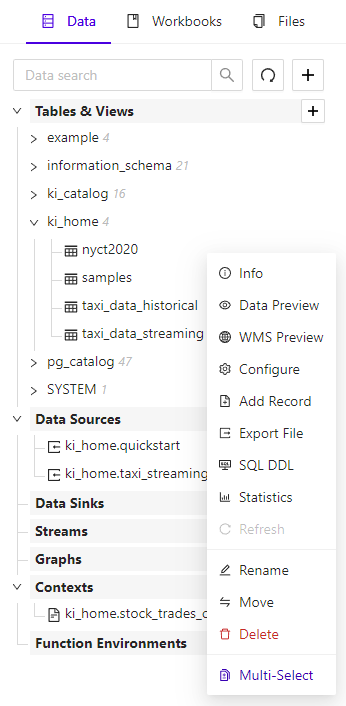
Data Explorer Table Actions
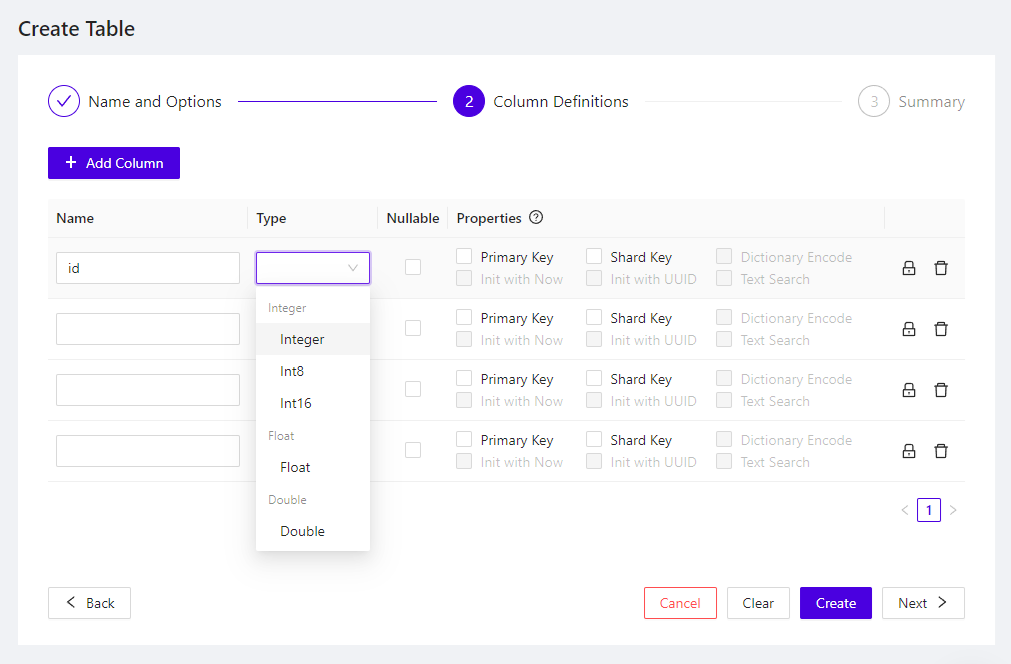
Create Table Wizard
Previewing Objects
You can preview an object’s data by clicking and selecting Data Preview. For tabular data, you will be shown a table view of the data.
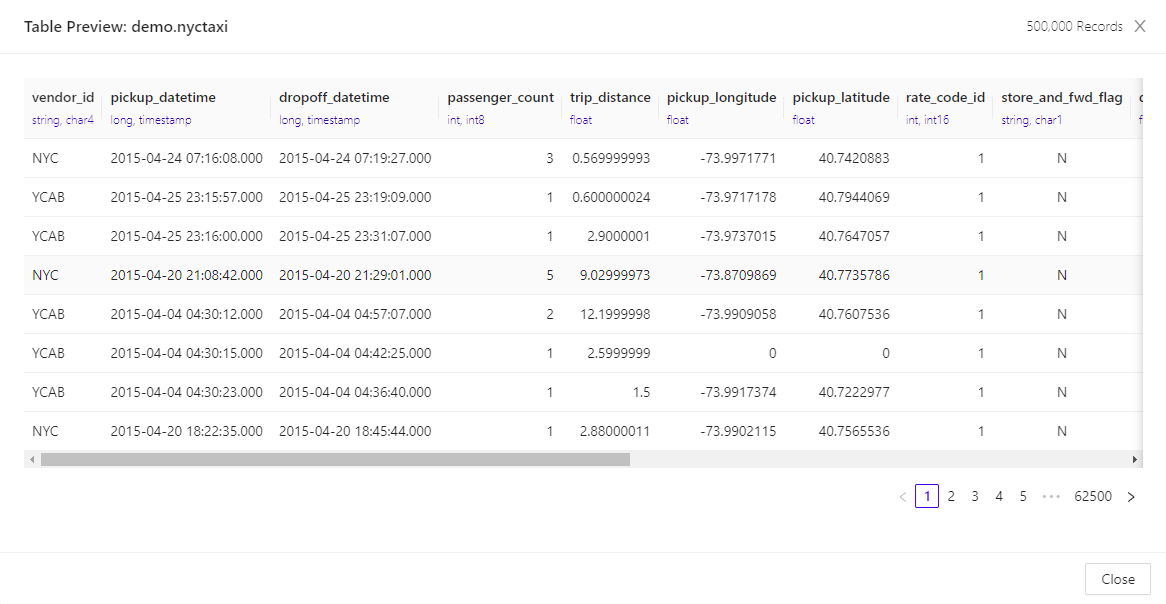
Data Grid Preview
You can also preview geospatial tabular data on a map by selecting WMS Preview. Abstract graphs, like social graphs cannot be previewed in the Workbench. Previewing a geospatial graph will display a map of the graph.
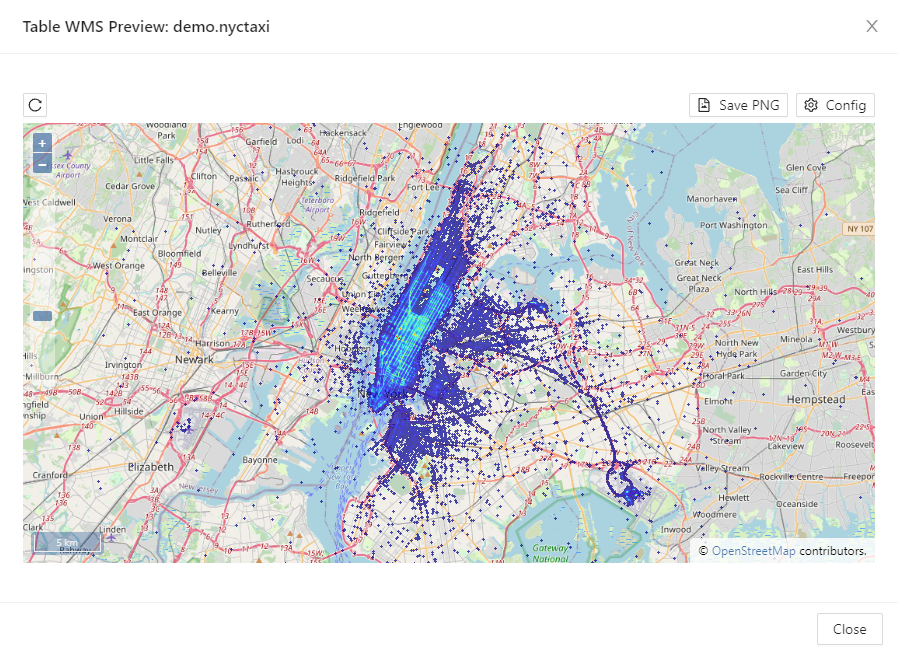
WMS Data Preview
Deleting Objects
To delete an object, click the object and select Delete.
Workbook Explorer
The Workbook Explorer contains two lists of workbooks:
- My Workbooks - a list of workbooks you've created, and the Quick Start Guide, which comes with each Kinetica deployment
- Examples - workbooks that are provided with Workbench for exploring the various features of Kinetica
- Shared With Me - a list of workbooks others have created and made available to you
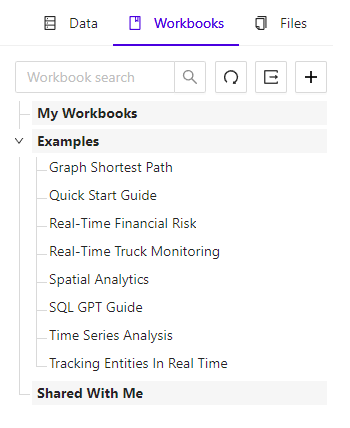
Workbook Explorer Tab
Creating a New Workbook
To create a new workbook, select the Workbook tab in the Explorer, then click the plus + button. Alternatively, you can create a new workbook using the large button on the Explore landing page.
After giving it a name, the new workbook will be displayed in the right-hand pane with a single empty SQL Block to start.
New Workbook
Example Workbook
Kinetica ships with a workbook that showcases an end-to-end analytics example through SQL. In this workbook, you will ingest data from S3, perform several analytic queries, and finally visualize the output on a map. To open the example workbook, click the Workbooks tab in the Explorer and select Quick Start Guide.
Exporting/Importing Workbooks
You can export and import workbooks to share your SQL. Right-click on a workbook in the Workbook Explorer and select the Export menu option. Choose Workbook JSON to initiate the download in JSON format.
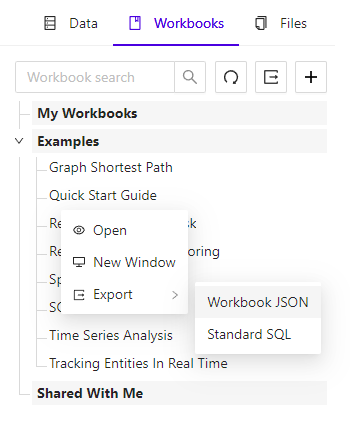
Export Workbook
To import a workbook, select the plus + button at the top right of the Workbook Explorer. This will open a dialog window that allows you to drag and drop a previously exported workbook.
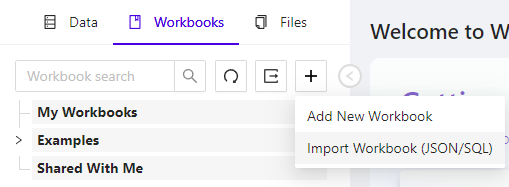
Import Workbook Menu
File Explorer
The File Explorer can be used to manage directories & files that reside in Kinetica File System (KiFS). This feature facilitates uploading local data files to import their data into Kinetica.
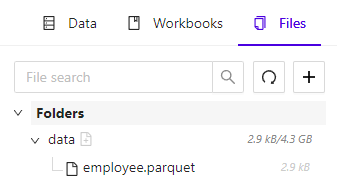
File Explorer Tab
Uploading a File
To upload a data file, select the Files tab in the Explorer to reach the File Explorer. Then, proceed either one of two ways:
- Click the plus + button at the top of the File Explorer panel and then click Upload New File
- Right-click the directory to upload the file into, and then click Upload New File
At this point a modal will open up, prompting the selection of a data file to upload from the local file system. Choose a file and then click Open. Then enter (or confirm) the name of the directory to upload the file to and, optionally, choose a different name for the uploaded file in KiFS. Click Upload to complete the file upload, and Close to close the modal.
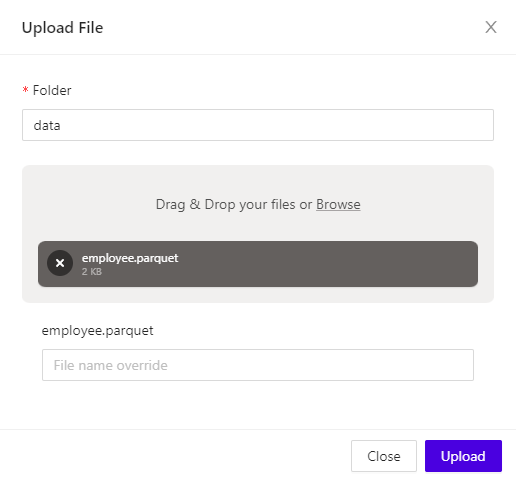
Upload File Dialog
Importing a File
To import a file from KiFS, select the Files tab in the Explorer to reach the File Explorer. Then, right-click the name of the file to upload and click Import.
The Kinetica Filesystem Import wizard will be displayed with the name of the file to import already populated in the File field.
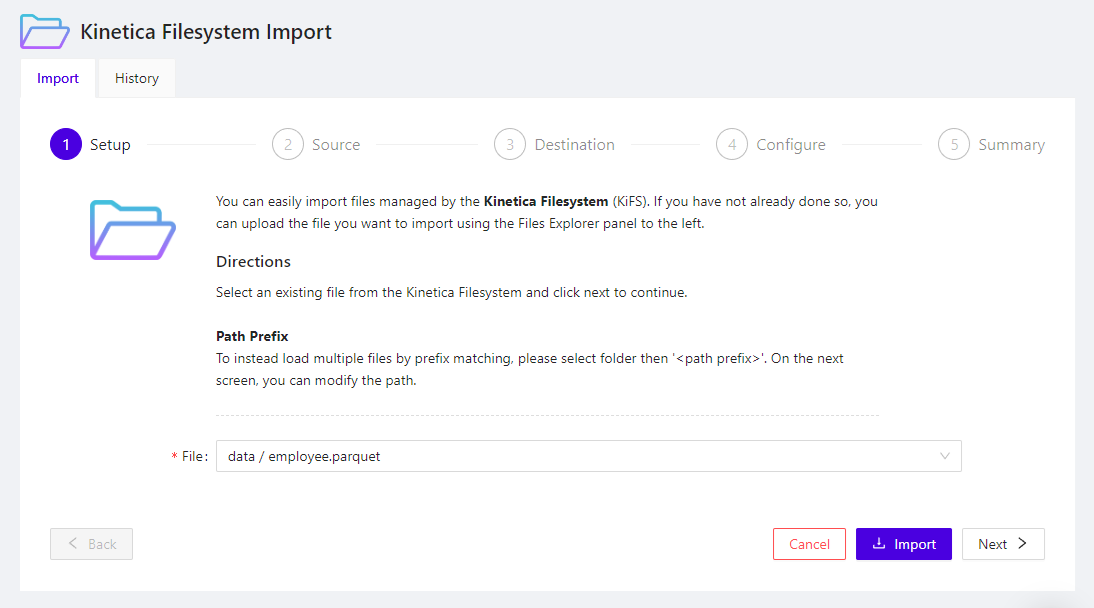
Import File
Click Import at any step of the wizard to import the file with the default options, along with any that have been configured in previous steps. See Import Data Wizard for the step-by-step walkthrough of the wizard.
SQL Workbooks and Worksheets
Workbooks can be accessed via the Explore page, using the top navigation.
This page will be used in the future to import workbooks from Kinetica’s Workbook Repository.
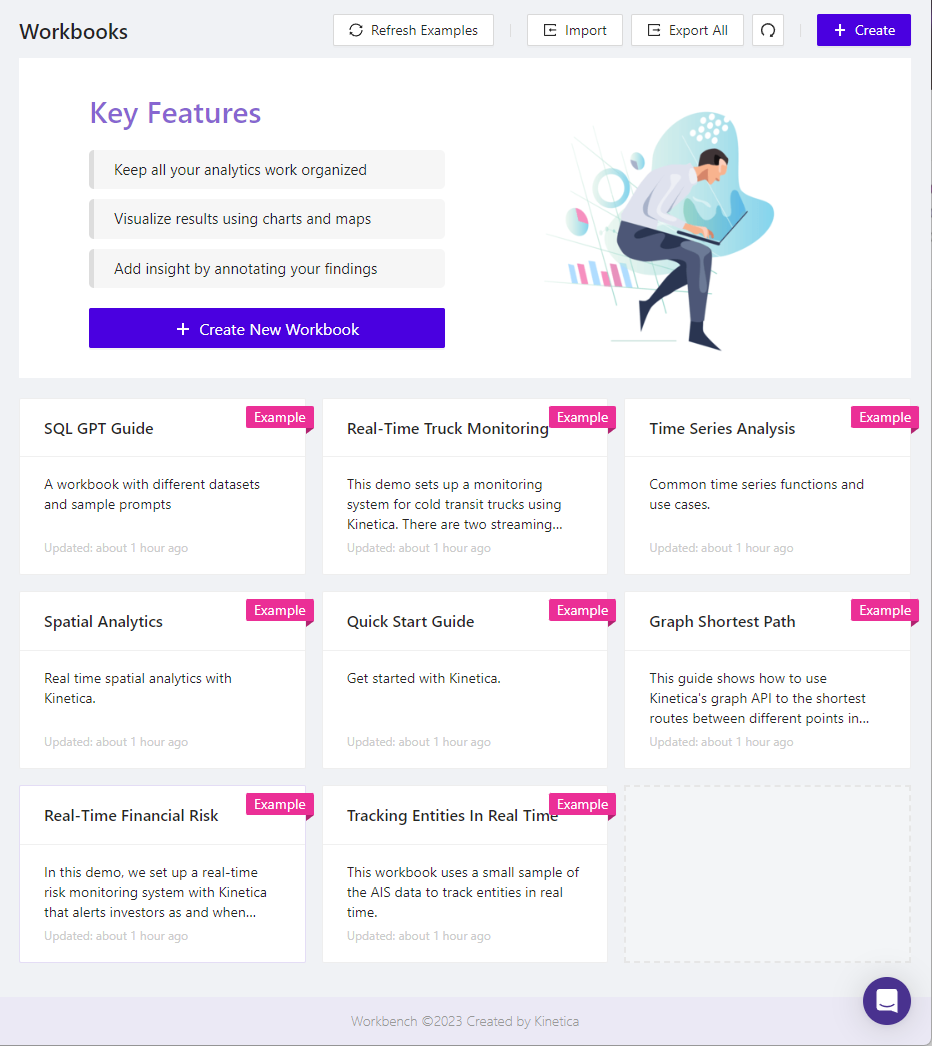
Explore Landing Page
Workbooks
A workbook is a container for worksheets.
Each worksheet begins with the SQL-GPT interface, followed by one or more data blocks and presentation blocks:
- Data blocks - blocks that interact with the database and display the results of queries and/or operations; these include:
- Presentation blocks - blocks that
display static content, usually used when converting a workbook to a
presentation medium, where these block types can help explain a workflow and
provide insight into the results of surrounding data blocks that do query
the database; these include:
- Text Blocks
- Image Blocks
- HTML Blocks
Any type of block can be moved up or down in the block ordering or removed using the buttons in the upper right corner of the block. You can also add another block directly below an existing one by using the plus + button in the upper right menu.
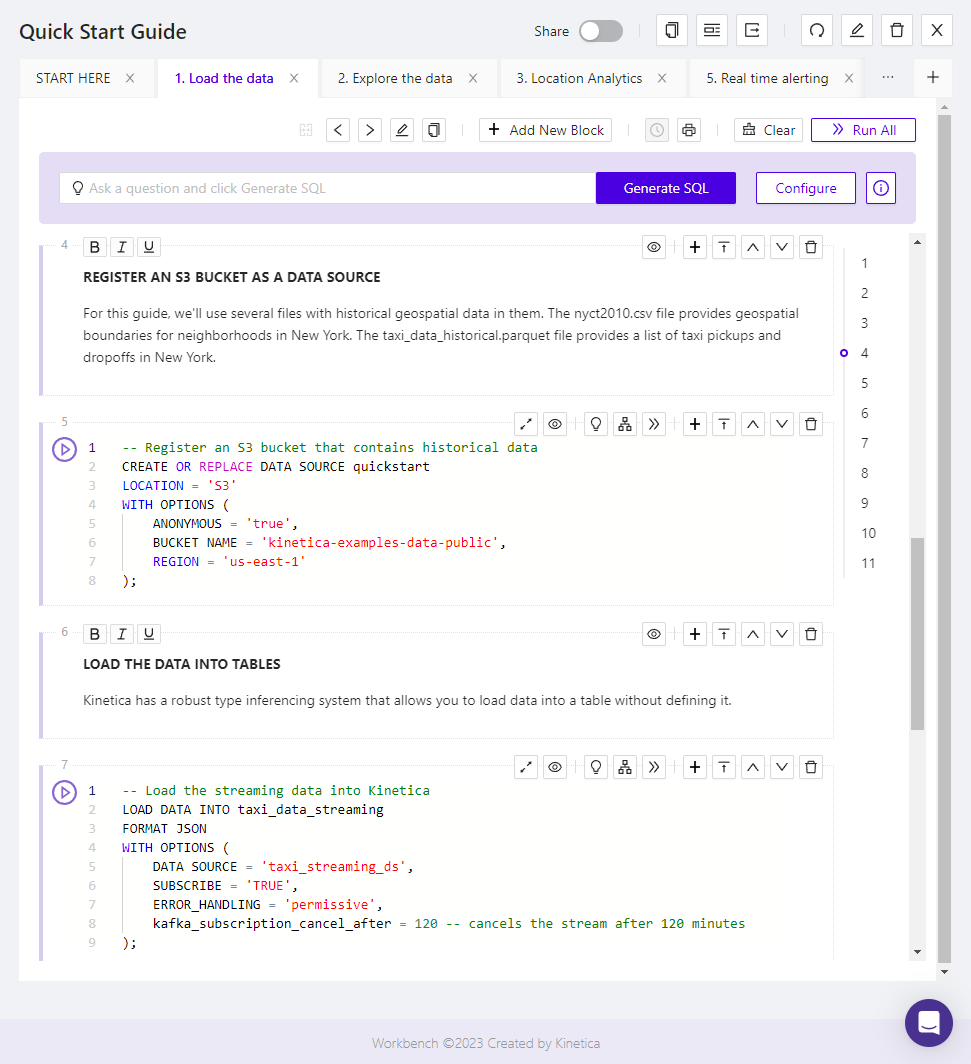
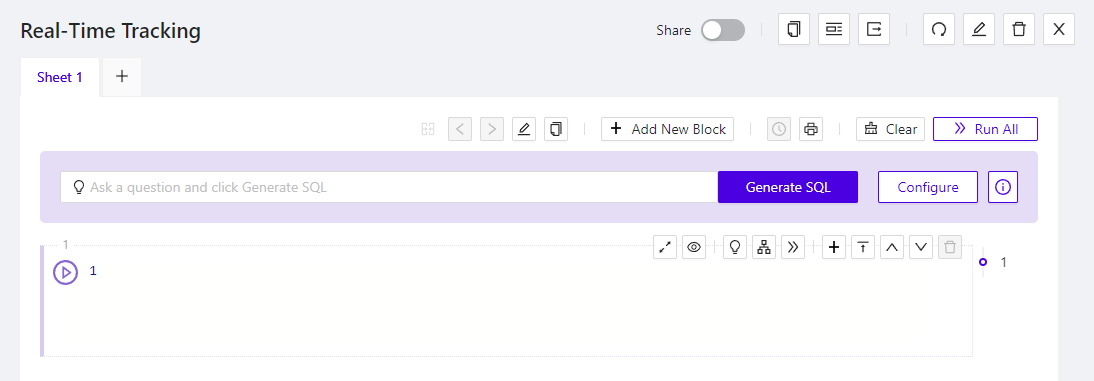
SQL Workbook
SQL-GPT
A SQL-GPT interface is present at the top of each worksheet within a workbook to facilitate natural language queries of data.
To use SQL-GPT to answer a question about your data:
- Enter a natural-language question into the SQL-GPT textbox.
- Click Generate SQL. A new SQL Block will be created at the bottom of the worksheet, pre-populated with the query SQL-GPT generated to answer the question posed.
- Click
 in that new SQL Block to run the generated query.
SQL-GPT will generate more accurate queries when it is given more context for the data it is querying. To provide SQL-GPT insight into the data and relationships between the data, see SQL-GPT Concepts for a SQL-GPT overview and SQL-GPT Syntax for the complete SQL syntax supporting SQL-GPT.
Once a custom SQL-GPT context has been created, click Configure to assign the context to the current worksheet, and ask the natural-language question again.
SQL Blocks
A SQL Block should contain a single SQL statement, which can be independently evaluated.
Each SQL Block has a play button on the left side that allows you to run the SQL contained in the block. Alternatively, you can run all the SQL Blocks in a worksheet in sequence by clicking the Run All button at the top of the screen.
If you want to create a visualization for a SQL Block, you will first need to create and run a SELECT statement. See Visualizations for directions on how to create visualizations in your workbook.
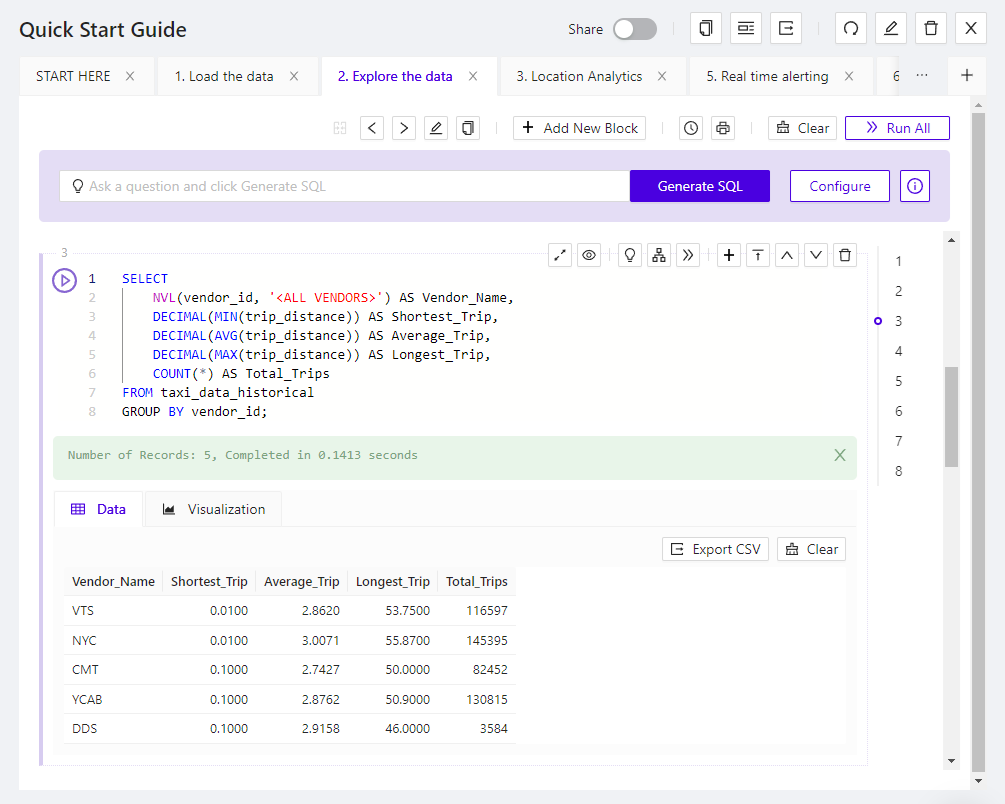
SQL Block with Output
Type-ahead
SQL Blocks feature a type-ahead capability that will suggest SQL syntax and database object names. When you begin typing, keywords will appear, and you will be able to select one of the items using the arrow keys. Pressing Enter while one of these keywords is highlighted will add it to your SQL Block.
For database objects, simply type a schema name and a dot (.); you should see all the tables and views in that schema appear in a dropdown list.
Running Individual Blocks
To run a SQL Block, click the play button next to it. When the job has finished, you will see an output notifying you of the success or failure. If you run a SELECT statement, you will see the result data presented in a data grid format, along with other visualization options. The data grid and visualizations are directly tied to the corresponding SELECT statement in the SQL Block.
Running All Blocks
You may also run the entire workbook from start to finish, in sequence, by clicking the Run All button in the upper right of the worksheet. As each SQL Block completes, the next will run until an error or the end of the workbook is reached.
Canceling Jobs
If you want to stop a long-running query or a long sequence of SQL Blocks, you can easily cancel the running jobs associated with each query. Use the Queries button at the top of the screen. This will open a modal with a list of all the running jobs in the system, any of which can be stopped by checking the box next to the job and pressing the Cancel Selected button.
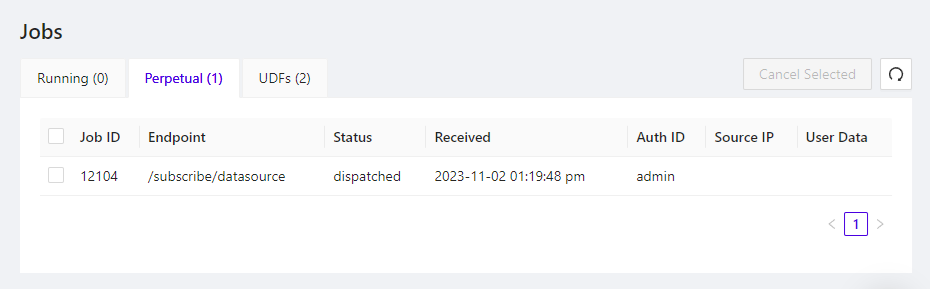
Running Jobs Listing
Visual Explain Plan
The explain plan visualizer is a graphical complement to using the EXPLAIN keyword in a given query, providing visual detail to the SQL query's execution plan, execution time, and native API translation(s).
In a given SQL Block, use the hierarchy icon to select Explain Plan. This will not execute the query but allow the database to walk through the native actions necessary to execute the query and show the plan.
Use the hierarchy icon to select Run and Analyze to execute the query and display the execution time for each step in the plan.
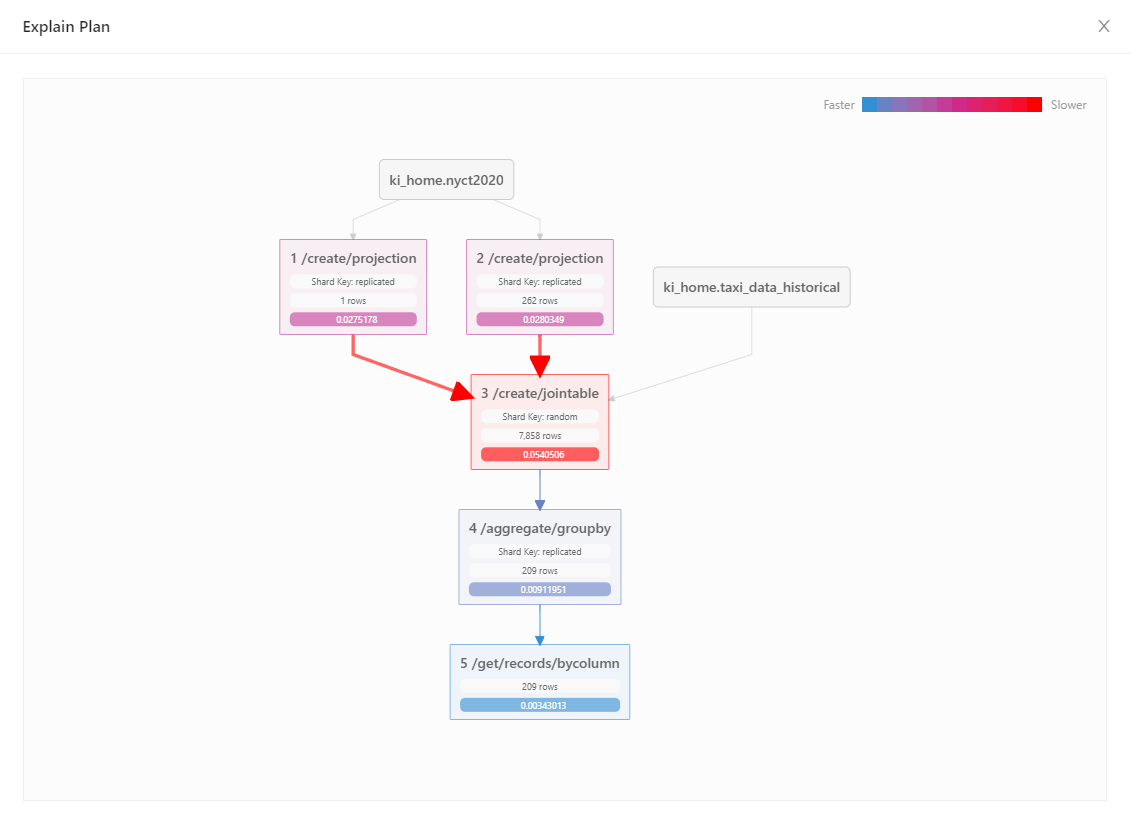
Visual Explain Plan
Map Blocks
A Map Block starts out as an empty map but can be configured to display geospatial data from a table.
Click on Configure to pick a source table and longitude & latitude columns. Then click Update to display the data on the map.
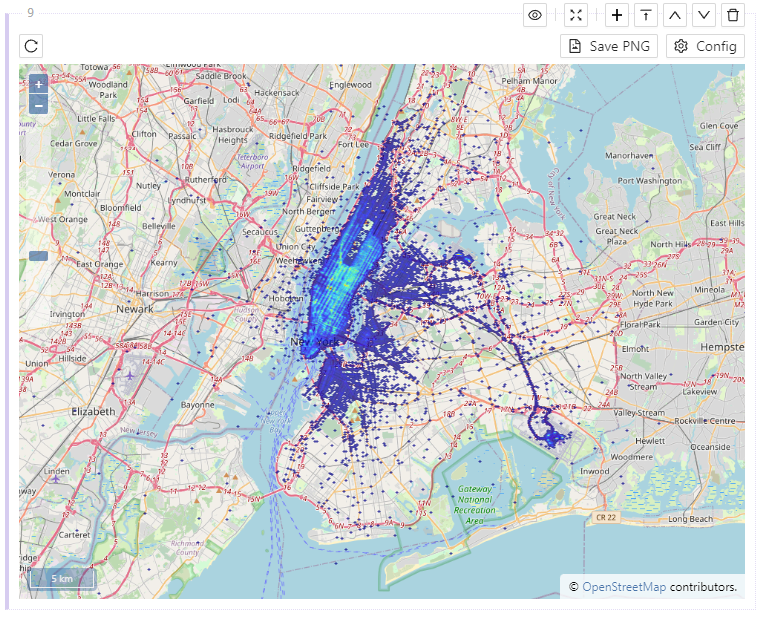
Map Block
Graph Blocks
A Graph Block starts out as a blank page but can be configured to display network graph data from a graph output table.
Click on Configure to pick a source graph table and specify the relevant node & edge columns. Then, click Update to display the graph within the block.
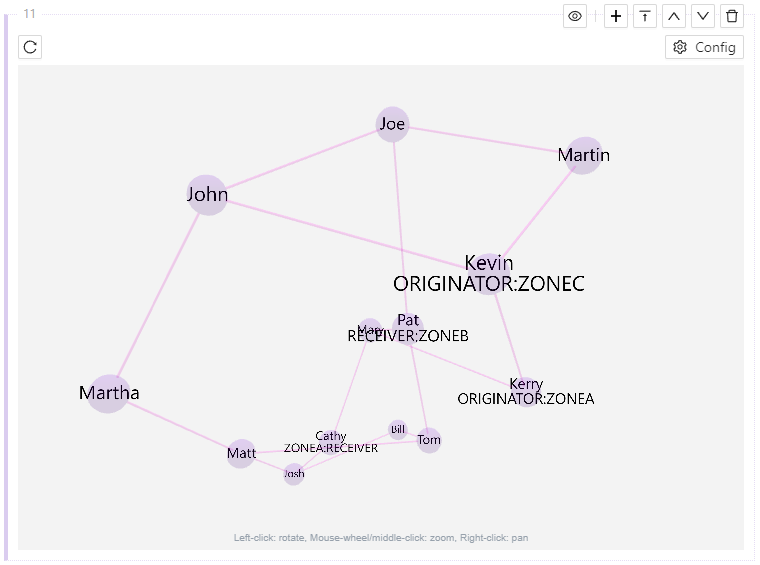
Graph Block
Graph Example
Given a person table of names & roles of people and a connection table
linking those people together, a social graph of those people and their
relations can be created by entering the following SQL into a SQL Block and
clicking ![]() :
:
CREATE GRAPH Example
| |
This will generate two output tables, which can be used to generate the graph:
- kgraph_table - the set of all edges (connections between people) in the data set
- kgraph_table_nodes - the set of all nodes (people) in the data set
Graph Example - Edges Only
To create the graph with just the names of people related to each other, define:
| Field | Value | Description |
|---|---|---|
| Edge Table Name | kgraph_table | Name of the edge table |
| Edge Source Column | EDGE_NODE1_NAME | Name of the person on one side of a relation |
| Edge Target Column | EDGE_NODE2_NAME | Name of the person on the other side of a relation |
Graph Example - Edges & Nodes
To create the graph with the names of people related to each other and additional information about the people, both the edge & node table will need to be referenced in the configuration. The data in the two tables will be linked together using their respective ID columns:
- kgraph_table.EDGE_NODE1_ID
- kgraph_table.EDGE_NODE2_ID
- kgraph_table_nodes.NODE_ID
| Field | Value | Description |
|---|---|---|
| Edge Table Name | kgraph_table | name of the edge table |
| Edge Source Column | EDGE_NODE1_ID | ID of the person on one side of a relation |
| Edge Target Column | EDGE_NODE2_ID | ID of the person on the other side of a relation |
| Node Table Name | kgraph_table_nodes | name of the nodes table |
| Node ID Column | NODE_ID | ID of a person |
| Node Name Column | NODE_NAME | Name of a person |
| Node Label Column | NODE_LABEL | Label containing extra information about a person |
Important
When using both the edge & node tables, the column values for the Node ID Column must match those for the Edge Source Column & Edge Target Column in that they should all be referencing either their respective ID or respective NAME columns.
Presentation Blocks
Presentation blocks help you annotate, elaborate on, and provide insight into the data blocks on your worksheet. These blocks can be moved up and down, independently of other blocks and provide rich flexibility in presenting your results. For more information on interacting with these blocks, see:
Visualizations
Once you have run a SQL Block that contains a SELECT statement, you have the option to visualize the result data. By default, the data will be displayed as a grid in the Data tab below the SQL Block. If you select the Visualization tab, you can visualize the data using one of the following modes:
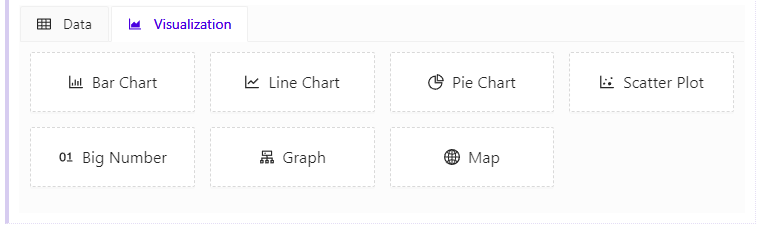
Visualization Selector
Choose a visualization style, click Configure to set up the graph, and then click Update to display the graph.
Bar Chart
The Bar Chart Visualization allows you to view volumes of data by group.
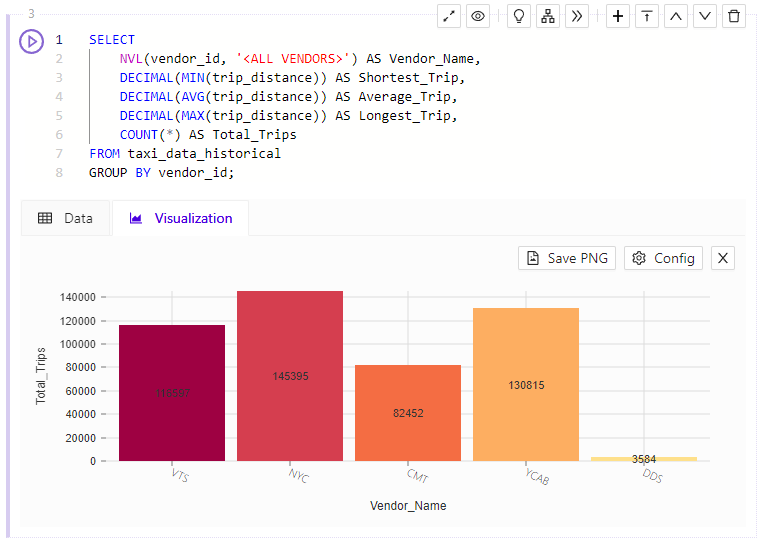
Bar Chart Visualization
Line Chart
The Line Chart Visualization shows you trends across a dimension.
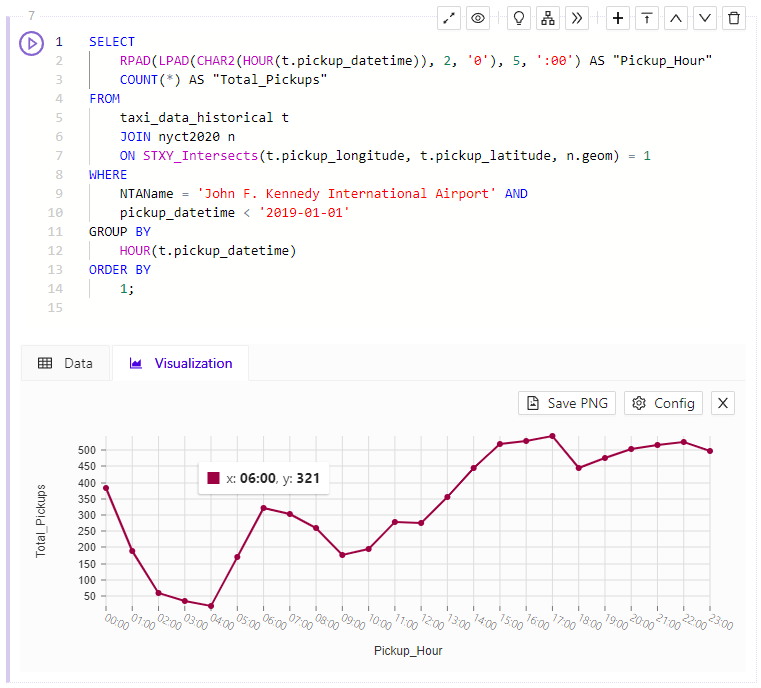
Line Chart Visualization
Pie Chart
The Pie Chart Visualization shows you the numeric proportion of values across several groups.
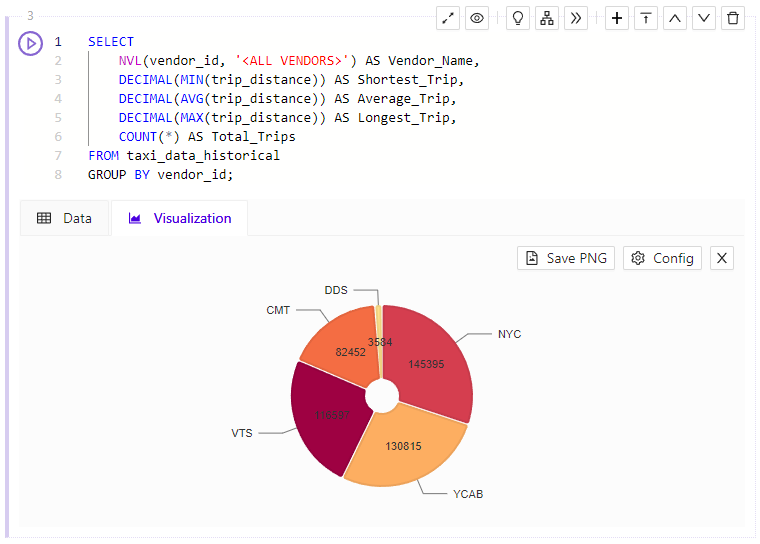
Pie Chart Visualization
Scatter Plot
The Scatter Plot Visualization shows you two dimensions compared against each other or two values compared to (or categorized by) a third value, plotted on a coordinate system.
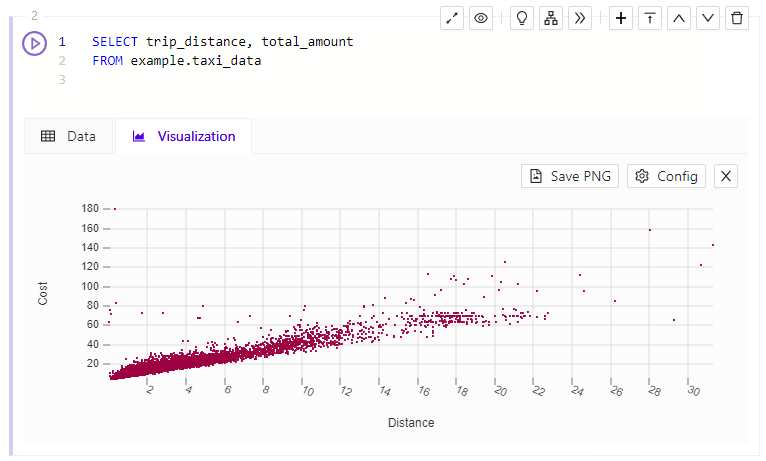
Scatter Plot Visualization
Big Number
The Big Number Visualization simply shows the result of a query in a large font. Multiple records are shown as a comma-delimited list of values.
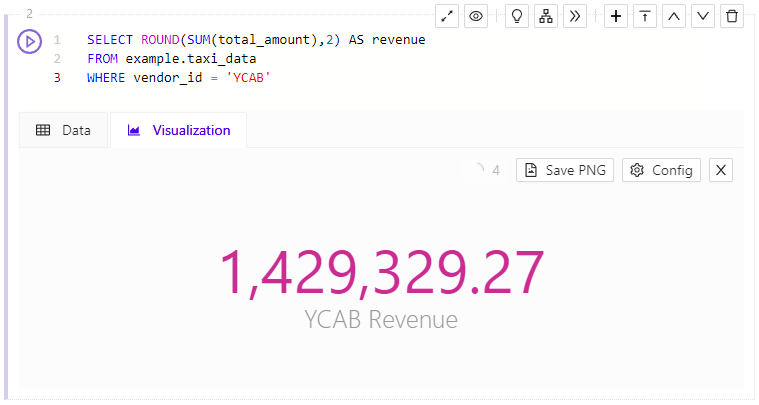
Big Number Visualization
Graph
The Graph Visualization is equivalent in interface to the graph block.
Map
The Map Visualization is equivalent in interface to the map block.
Importing Data
Whether you’re importing directly via SQL, or using the import wizard, loading data into Kinetica is easy. Several data sources are supported when ingesting data through either mechanism. See Data Sources for more information on data sources or CREATE DATA SOURCE for managing them in SQL.
Import Data Wizard
Importing data via the wizard can be done in several easy steps.
- Click Import on the top menu to reach the Importing Your Data page.
- Choose the import mechanism to use:
- File Upload - Import data from a file on your local file system
- Kinetica Filesystem - Import data from a file that has already been uploaded to KiFS
- Azure Blob Storage, Amazon S3, Kafka Stream, HDFS - Import data from one of these external providers.
- Generic JDBC - Import data from a remote database using a generic JDBC driver
- Kinetica - Import data from another Kinetica cluster using the Kinetica JDBC driver
- JDBC Data Sources - Import data from a remote system using any of the available data source drivers
- If ingesting from a external provider like S3, you can either select an existing data source corresponding to that provider or create a new one.
- Enter the path to the file, and choose the file format.
- Next, select the schema in which your new table should be created. Then give your new table a name. By default, records that fail to be parsed or loaded correctly will be skipped and the import process will proceed to the subsequent records. To stop the import if an error occurs on a record, check the appropriate box. Optionally, define the structure of the target table if that table does not yet exist. If the table doesn't exist and the structure is not defined here, it will be intuited by analyzing the source file headers & data.
- Once the ingest has been configured, the corresponding SQL statement for loading the data will be displayed, which you can copy into a worksheet for use later. Click Import to begin the import immediately, and wait for the job to complete. You can see the status of jobs in the History tab, and you can see error messages to help you troubleshoot the import there as well.
For a more detailed look at the configuration options available through the Import Wizard, see Import.
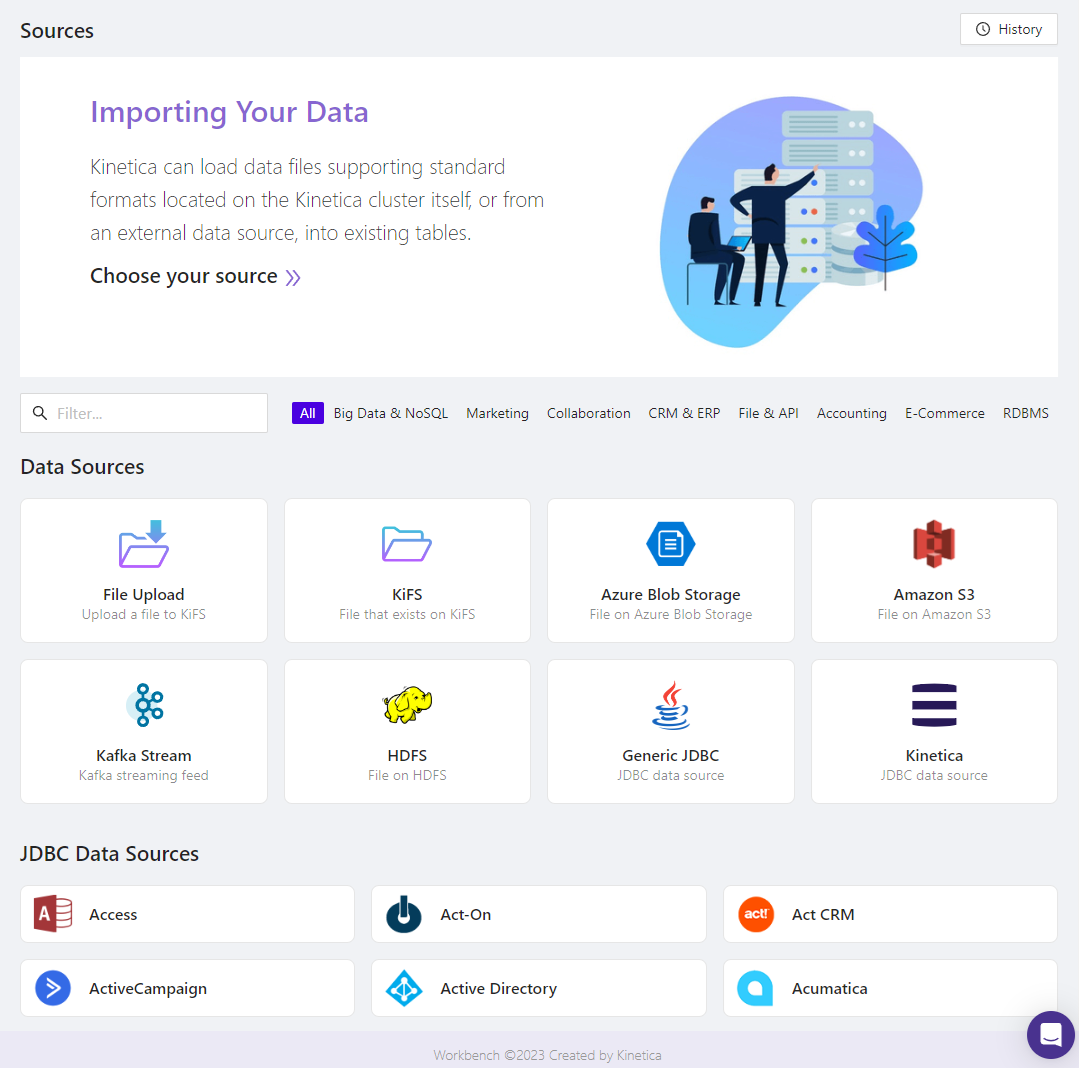
Import Landing Page
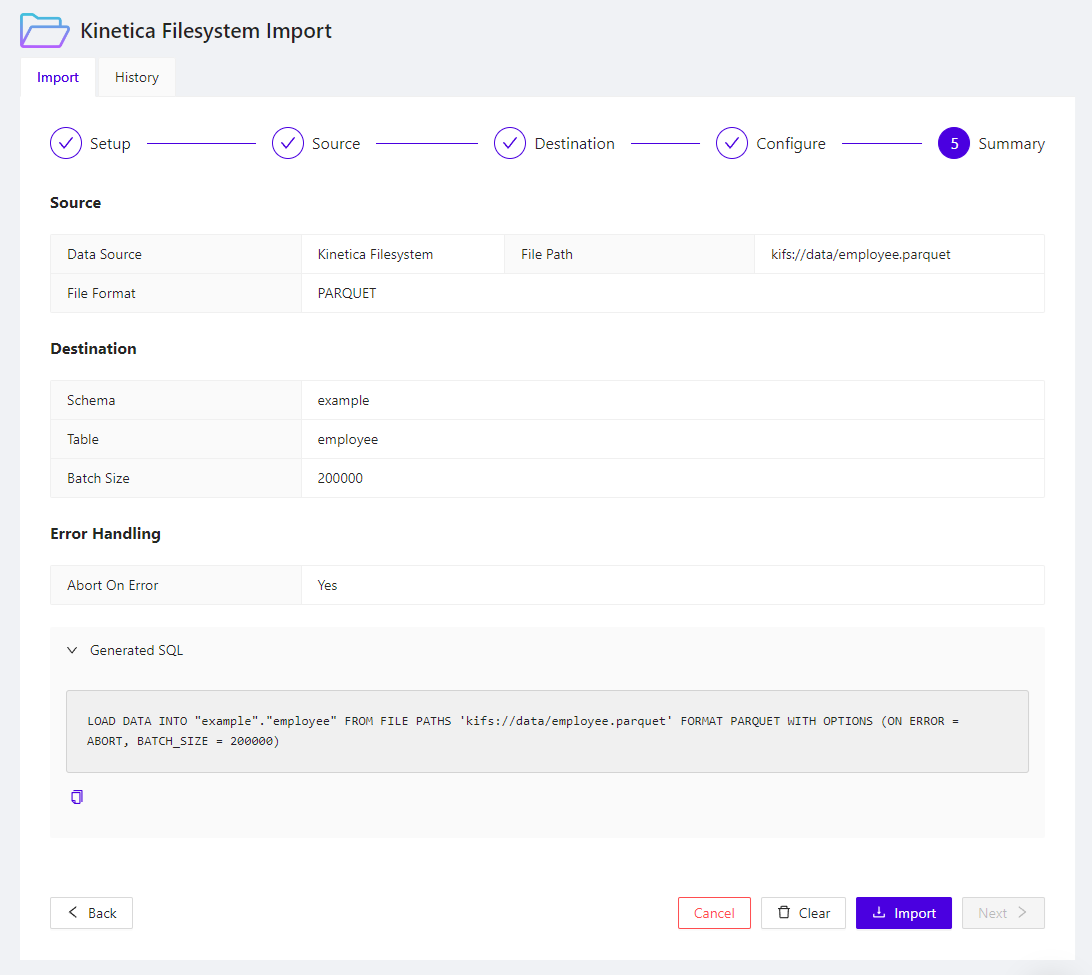
Import Data Summary, with Corresponding SQL Import Statement
Import via SQL
You can use the SQL generated by the Import Data Wizard in your SQL Worksheets, or you can write your own ingest statements. When importing from a remote location, like S3, you will need to create a data source first. See CREATE DATA SOURCE for the syntax used to create one.
For example, to load taxi data from S3:
Create an S3 Data Source
| |
Once you’ve created a data source, you can load data using the LOAD INTO statement.
Load Taxi Data from S3
| |