

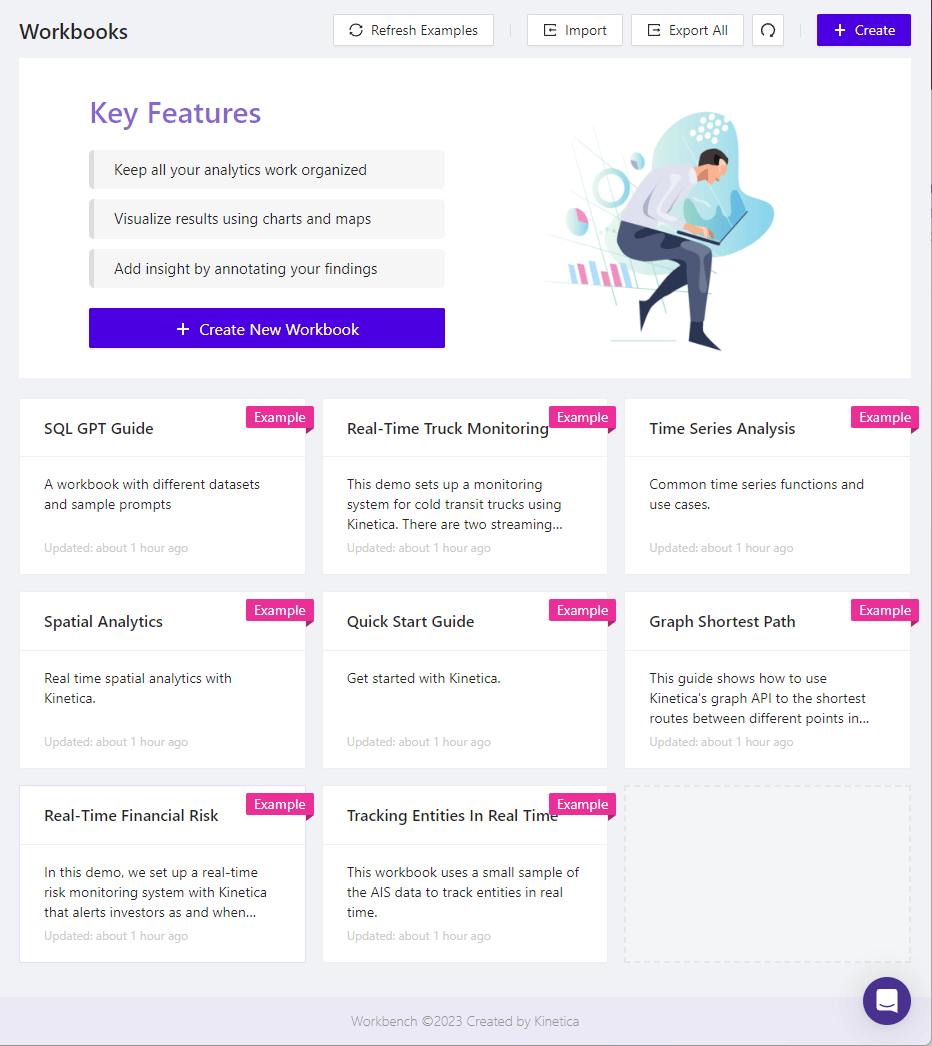
| Action | Description |
|---|---|
| Refresh Examples | Update the sample workbooks to their latest versions |
| Import | Import a workbook from a JSON file |
| Export All | Export all workbooks listed under My Workbooks to a single JSON file |
 | Update the list of displayed workbook panels |
| + Create | Create a new workbook |
Workbooks
When a workbook is selected, its first worksheet is displayed, along with a corresponding tab for each of its other worksheets. Click the tabs to switch between worksheets, and click the + to create a new worksheet.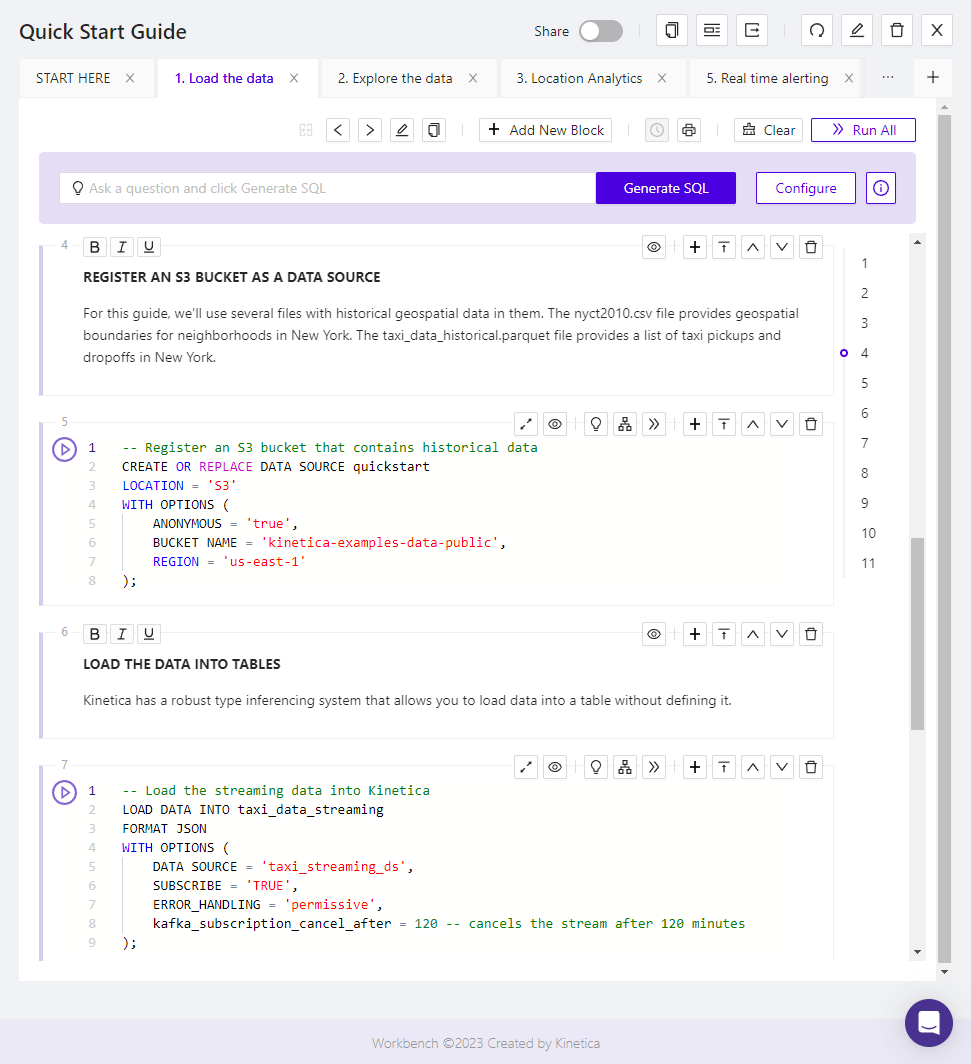
Quick Start Workbook
| Action | Description |
|---|---|
| Share | Toggle sharing of this workbook with all other users in the cluster |
 | Make a duplicate of this workbook, appending Copy to the end of the workbook’s name |
 | Display two means of referencing this workbook: * URL - a URL that can be used to link directly to this workbook, opening it in Workbench * HTML - an HTML snippet that can be used to embed this workbook as an iFrame within another web page; note that this will require logging into Workbench in that frame to access the embedded workbook |
 | Export this workbook in either JSON format or as a series of SQL statements in a text file |
| Refresh the displayed blocks of this workbook |
 | Modify the name or description of this workbook |
 | Delete this workbook |
 | Close this workbook and return to the Explore landing page |
Worksheets
The active worksheet displays the SQL-GPT interface at the top, followed by its contained blocks in the order they are defined within the worksheet. Block types include: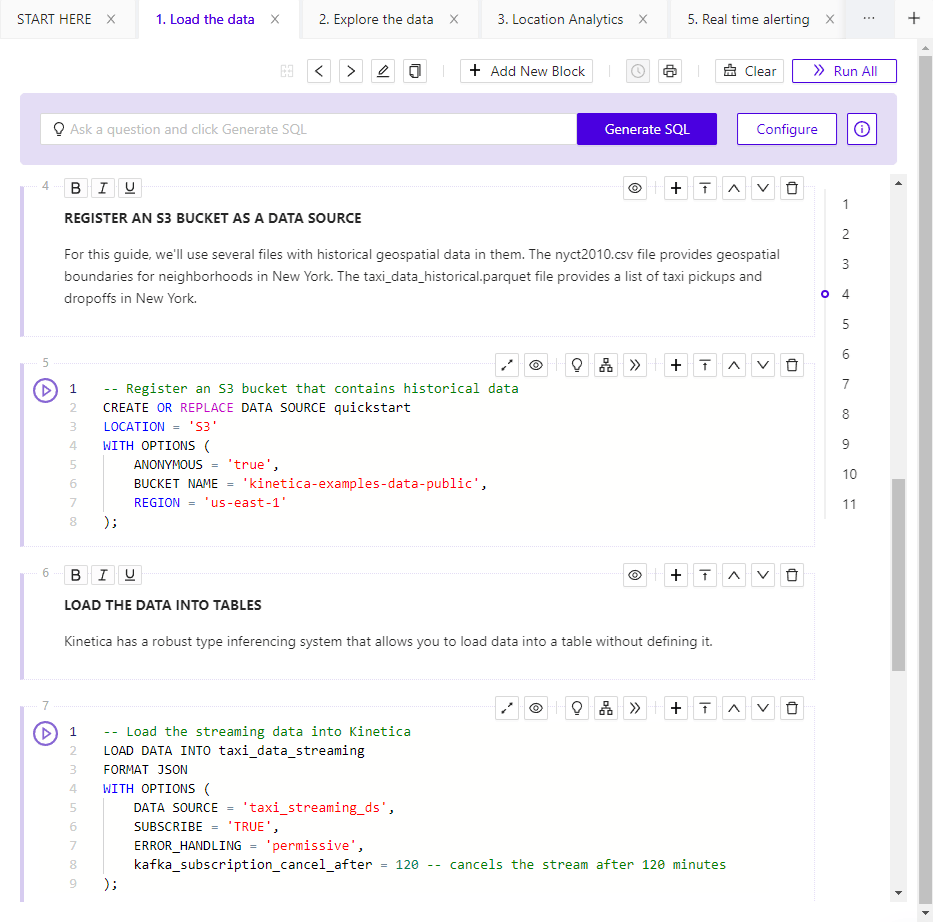
Quick Start Worksheet #1
| Action | Description |
|---|---|
 | Move this worksheet closer to the front of the workbook |
 | Move this worksheet closer to the back of the workbook |
 | Modify the name or description of this worksheet |
 | Make a duplicate of this worksheet in either the current workbook or another workbook, appending Copy to the end of the workbook’s name |
 | Add a new block of the selected type to the end of this worksheet |
 | Download a performance report of all queries run within the worksheet |
 | Display a printable version of the worksheet |
 | Clear all query results in SQL Blocks on this worksheet |
 | Run all SQL Blocks on this worksheet in the sequence in which they appear on the worksheet |
SQL-GPT
Each worksheet within Workbench has an interface for interacting with SQL-GPT at the top.
SQL-GPT Interface
| Action | Description |
|---|---|
 | Generate a corresponding SQL query for the natural language question entered into the SQL-GPT text box, and add it to a SQL Block as the last block on the worksheet |
 | Open the SQL-GPT configuration page |
 | Learn more about how to configure & use SQL-GPT |
SQL-GPT Configuration
The SQL-GPT Configuration page allows one or more SQL-GPT contexts to be assigned to this worksheet.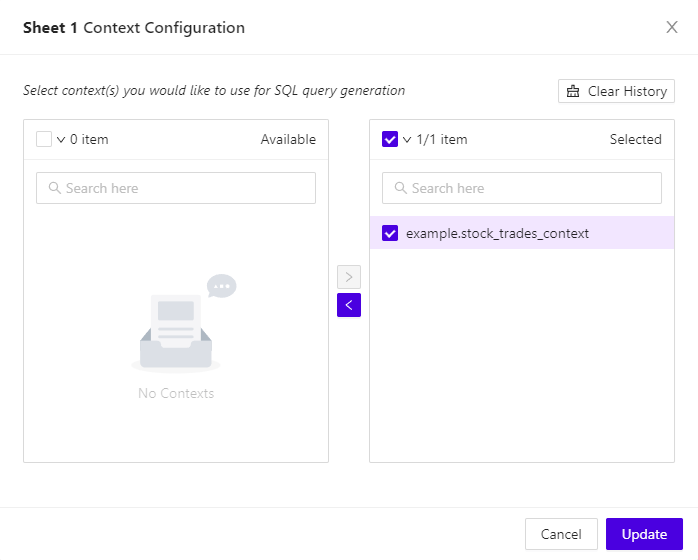
SQL-GPT Configuration
SQL Blocks
Each SQL Block allows one or more SQL statements to be added or modified within it.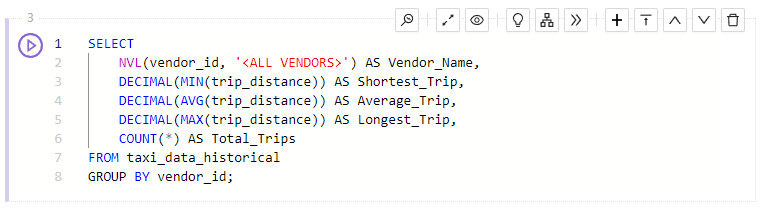
SQL Block
| Action | Description |
|---|---|
 | Run the SQL statement(s) in this SQL Block, and output the result set of the final query (if one exists) at the bottom of this block, in either data grid or chart form |
 | View the job status for the query executing in this SQL Block; the status will be displayed at the bottom of the block |
 | Expand or collapse this block when the enclosing workbook is embedded in another web page |
 | Hide or show this block when the enclosing workbook is embedded in another web page |
 | Insert a SQL-GPT text box for generating SQL into this SQL Block |
 | Display the explain plan of the final query in this SQL Block, if one exists: * Explain Plan - display the basic execution plan * Run and Analyze - run the final query and display the execution plan with a statistical analysis |
 | Run all SQL Blocks from this one onwards, until the end of the worksheet |
 | Add a new block of the selected type below this one |
 | Collapse this block, showing only one line of it configuration; click again to expand the block |
 | Move this block one block above its current position on this worksheet |
 | Move this block one block below its current position on this worksheet |
 | Remove this block from this worksheet |
Data Tab
The Data tab displays a grid view of the result set of the final query in a SQL Block, when run.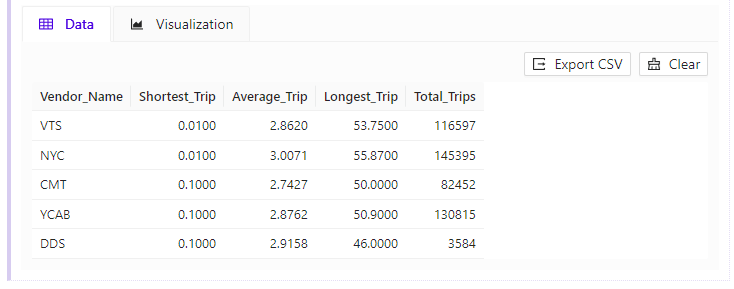
SQL Block Query Results Grid
- Export CSV - export the result set to a comma-separated values (CSV) file and download the file
- Clear - remove the result set portion of the SQL Block
Visualization Tab
The Visualization tab allows the result set of the final query in a SQL Block to be displayed as a visualization, when run.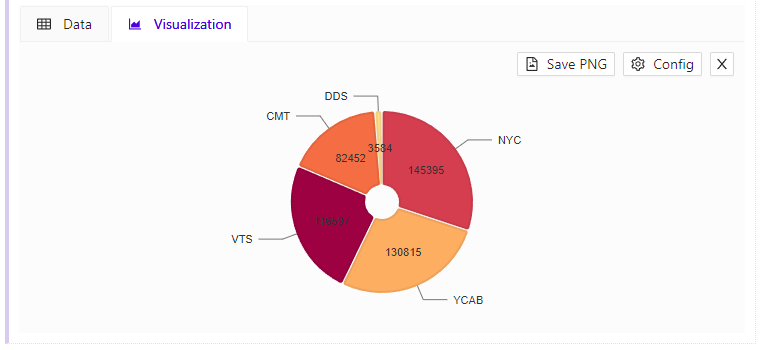
SQL Block Query Results Visualization
- Bar Chart
- Line Chart
- Pie Chart
- Scatter Plot
- Big Number
- Graph
- Map
Text Blocks
A Text Block can be used to document the surrounding blocks.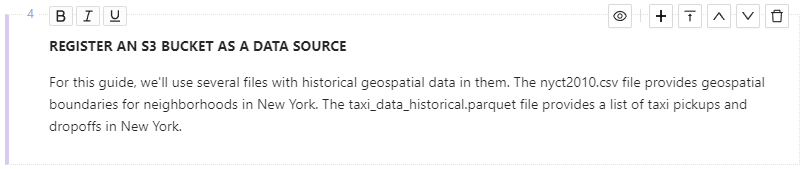
Text Block
| Action | Description |
|---|---|
 | Apply bold styling to the highlighted text |
 | Apply italics styling to the highlighted text |
 | Underline the highlighted text |
| Hide or show this block when the enclosing workbook is embedded in another web page |
| Add a new block of the selected type below this one |
| Collapse this block, showing only one line of it configuration; click again to expand the block |
| Move this block one block above its current position on this worksheet |
| Move this block one block below its current position on this worksheet |
| Remove this block from this worksheet |
Image Blocks
An Image Block can be used to display a static or animated URL-accessible image.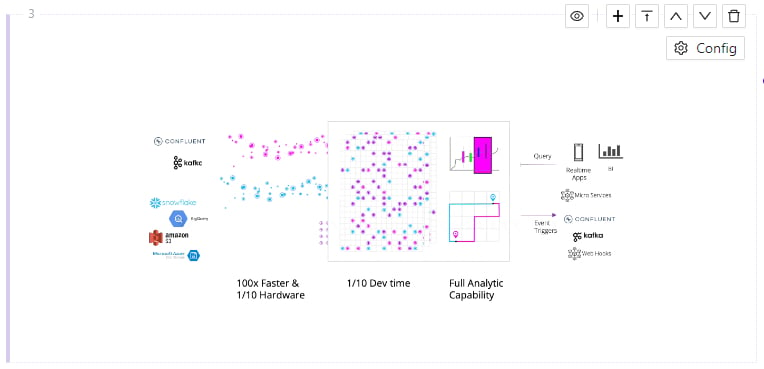
Image Block
| Action | Description |
|---|---|
 | Open the image configuration page |
| Hide or show this block when the enclosing workbook is embedded in another web page |
| Add a new block of the selected type below this one |
| Collapse this block, showing only one line of it configuration; click again to expand the block |
| Move this block one block above its current position on this worksheet |
| Move this block one block below its current position on this worksheet |
| Remove this block from this worksheet |
Image Configuration
The Image Configuration page allows the associated image to be configured. The image needs to be specified with an accessible URL and alignment within the block. It can optionally be given a title and a scaling height & width.HTML Blocks
An HTML Block can be used to display user-entered HTML.
HTML Block
| Action | Description |
|---|---|
| Open the HTML configuration page |
| Hide or show this block when the enclosing workbook is embedded in another web page |
| Add a new block of the selected type below this one |
| Collapse this block, showing only one line of it configuration; click again to expand the block |
| Move this block one block above its current position on this worksheet |
| Move this block one block below its current position on this worksheet |
| Remove this block from this worksheet |
HTML Configuration
The HTML Configuration page allows the HTML source and title to be modified. HTML tags that may pose security risks will remain in the user-entered source, but not be displayed in the HTML Block. HTML tags are not supported for the title.Map Blocks
A Map Block is an empty zoomable & pannable world map, upon creation, that can be configured to display geospatial data from any table or view.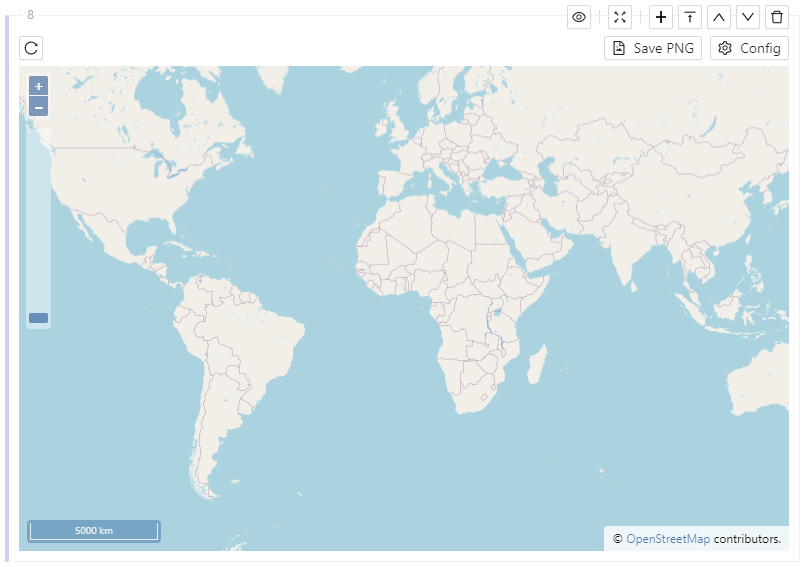
Map Block
| Action | Description |
|---|---|
 | Refresh the map, reloading any data from the source, if configured |
 | Download a copy of this map at its current zoom level and pan position |
| Configure a source table to plot on this map, as well as other map-related settings |
| Hide or show this block when the enclosing workbook is embedded in another web page |
 | Pop up a near full-screen configurable view of this map |
| Add a new block of the selected type below this one |
| Collapse this block, showing only one line of it configuration; click again to expand the block |
| Move this block one block above its current position on this worksheet |
| Move this block one block below its current position on this worksheet |
| Remove this block from this worksheet |
Rendering Modes
Kinetica supports two different geospatial rendering modes:- Heatmap: A gradient of color that represents the density of features/shapes
- Raster: Discrete colorization of each feature/shape
- Class Break: A class (range) based colorization of each feature/shape
- Track: A rasterization of features/shapes containing track information
- Contour: A 3-dimensional planar graph, where each plane is bounded by isolines and contains data with the same z value
- Table Options - Source table & columns, along with the rendering mode
- Map-Specific Options - Options that are specific to each map type
- Viewport Options - Latitude, longitude, & altitude upon which the map is centered
- Advanced Options - WMS key/value pairs that can be set to override or extend the map configuration. See Web Map Service for details.
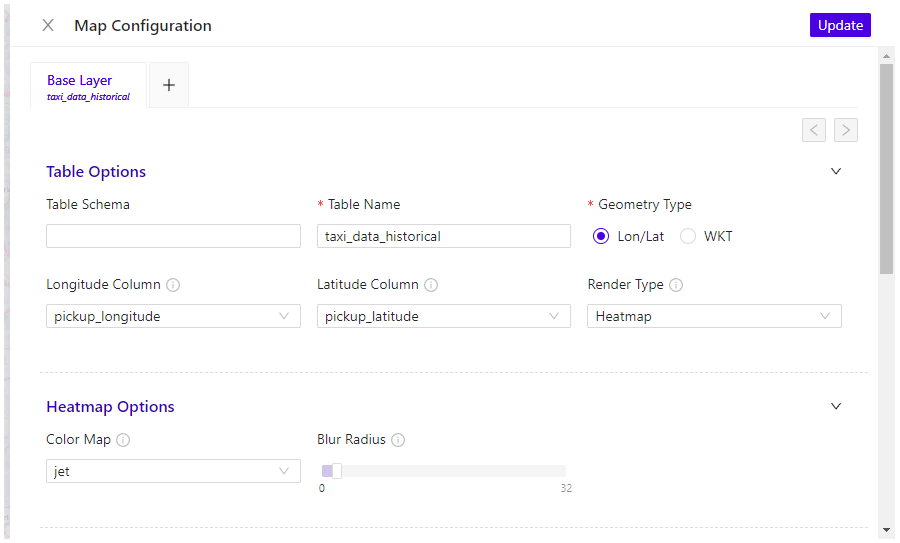
Map Visualization Configuration
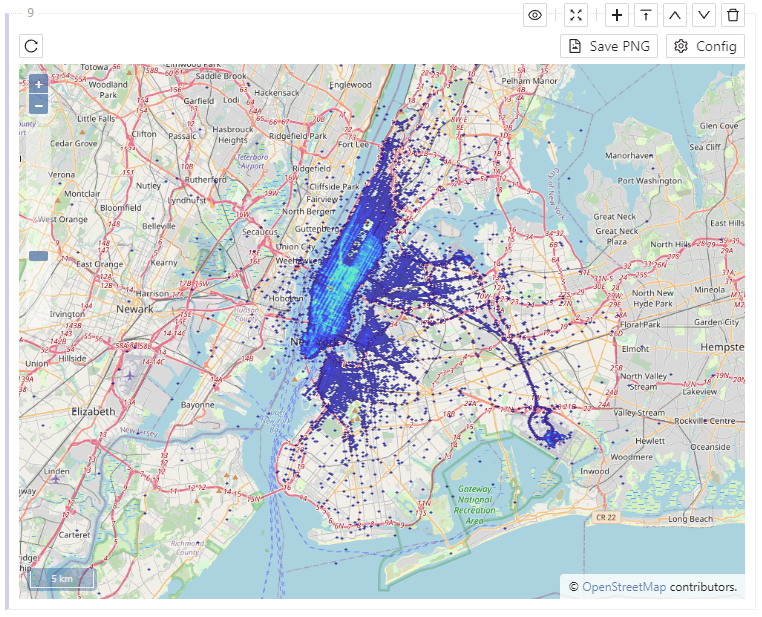
Map Visualization
Graph Blocks
A Graph Block is a visual graph of a given graph-oriented data set.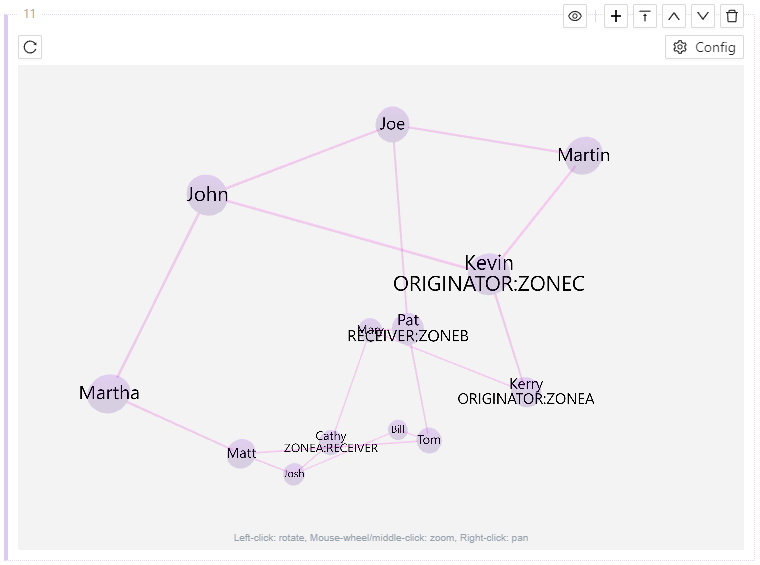
Graph Block
| Action | Description |
|---|---|
| Refresh the graph, reloading any data from the source |
| Open the graph configuration page |
| Hide or show this block when the enclosing workbook is embedded in another web page |
| Add a new block of the selected type below this one |
| Collapse this block, showing only one line of it configuration; click again to expand the block |
| Move this block one block above its current position on this worksheet |
| Move this block one block below its current position on this worksheet |
| Remove this block from this worksheet |
Graph Configuration
The Graph Configuration page allows the graph source data set to be specified and modified.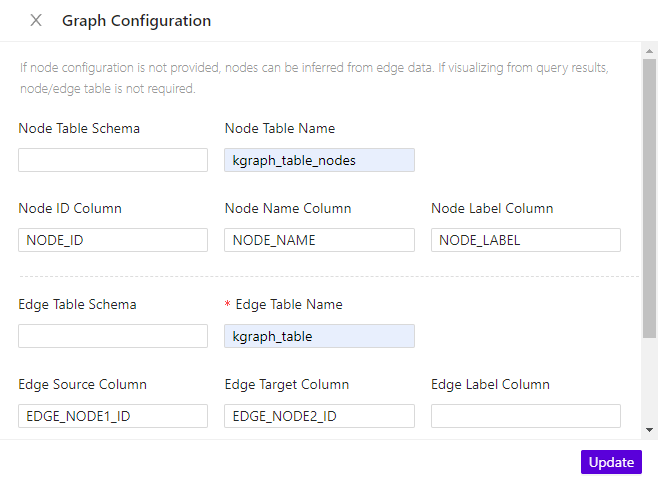
Graph Configuration